


-
Dear Editor,
East Lake, located in the middle and lower reaches of the Yangtze River, is a major source of drinking water for local residents. However, the large increase of population density and the rapid development of industry has resulted in heavy eutrophication of East Lake over the past few decades. Microcystis aeruginosa is a well-known toxic algae-blooming cyanobacterial species (Carmichael W W, et al., 2001) and a major player in the cyanobacterial water blooming in East Lake. Cyanophages are considered to be a significant factor in preventing algal blooming by causing the death and regulating the abundance, clonal diversity, and composition of their cyanobacterial host populations (Suttle C A, et al., 1992; Tucker S, et al., 2005). Recently, in our high-throughput sequencing data of water samples collected in East Lake, a high proportion of sequences were found homologous to the genomic sequences of a cyanophage strain, Ma-LMM01, which was isolated from Lake Mikata in Japan in 2006, and specifically infects a toxic strain (NIES298) of M.aeruginosa (Yoshida T, et al., 2006). We then conducted a one-year survey of the abundance of M. aeruginosa and the Ma-LMM01-type cyanophage in East Lake using real-time quantitative PCR (qPCR). Our results demonstrated a clear chronological dynamic correlation between Ma-LMM01-type cyanophage and the host M. aeruginosa in East Lake.
We collected water samples at a depth of 0.5 m once a month from May 2012 to April 2013 from four fixed points (DH1: 30°32′54.78″N, 114°21′14.43″E; DH2: 30°32′45.43″N, 114°22′1.35″E, DH3: 30°32′22.98″N; 114°23′28.43 E; and DH4: 30°32′48.03″N, 114°25′23.16″E) in East Lake, Wuhan, China (Fig. 1A). The four sample sites, which are close to the residential areas, university, hospital, and scenic spots, respectively, represent the different ecological environments.
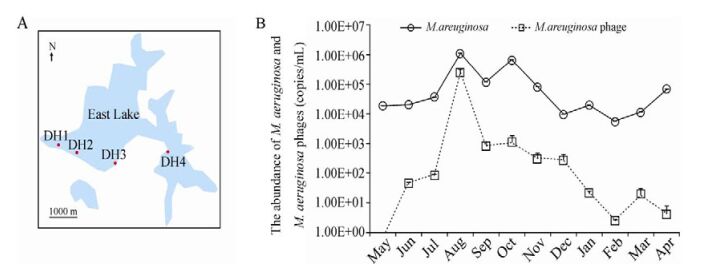
Figure 1. Sampling sites (DH1, DH2, DH3 and DH4) (A) and Abundance of M. aeruginosa and M. aeruginosa cyanophage from May, 2012 to April, 2013 (B) in East Lake. The numbers of DNA copies/mL were determined using real-time qPCR. The error bars indicate the standard deviations of three experiments.
For concentrating cyanobacteria samples, 4 L water was collected from each of the four sample sites and kept in the dark during the transport to the laboratory. After being filtered through 16 layers of gauze, the filtrate was preserved in Lugol's solution and concentrated to 40 mL, followed by immediate storage in the dark at 4 ℃ until processing. For concentrating virus samples, 100 L water was collected from each of the four sample sites and processed within 2 hours as described previously (Thurber R V, et al., 2009). Briefly, the samples were serially filtered through 1 μm and 0.45 μm filters, concentrated to about 1/50th of their original volume using a tangentialflow ultrafiltration system (Millipore) and stored immediately in the dark at 4 ℃ until processing.
To extract bacterial DNA, particles including cyanobacteria were sonicated gently and harvested by centrifugation at 14, 400 g for 10 min. The DNA was extracted using a modified XS-SDS protocol (Yilmaz and Phlips, 2009). Briefly, collected cells were suspended in 50 μL TE buffer (10 mmol/L Tris-HCl 1mmol/L EDTA, pH7.4), then mixed with 750 μL of freshly prepared XS buffer (1% potassium ethyl xanthogenate; 100 mmol/L Tris-HCl, pH 7.4; 20 mmol/L EDTA, pH 8; 800 mmol/L ammonium acetate; and 1% SDS) and incubated for 2 h at 70 ℃. The mixture was mixed by vortex for 30 s, incubated on ice for 30 min and centrifugated for 10 min at 15, 000 g. The supernatant was collected and added with PEG 8000 and MgCl2 at a final concentration of 7% and 10 mmol/L repectively. The DNA was precipitated by incubating the mixture at room temperature for at least 10 min or at 4 ℃ overnight. After being centrifuged at 15, 000 g for 15 min, the DNA pellet was washed in 70% ethanol, air-dried, and dissolved in sterile double distilled water. To extract viral nucleic acids, the viral samples were filtered through 0.2 μm polycarbonate filters and concentrated by ultracentrifugation at 111, 000 g for 2 h at 4 ℃. Then viral DNA was extracted using a QIAamp DNA Mini Kit (Qiagen, Hilden, Germany).
The extracted DNA was used as the template of real-time qPCR to detect the abundance of M. aeruginosa and cyanophage. A 66 bp fragment of PC-IGS gene from M. aeruginosa and a 132 bp fragment of the g91 gene from cyanophage were respectively amplified by the primer pairs 188F (5'-GCTACTTCGACCGCGCC-3') / 254R (5'-TCCTACGGTTTAATTGAGACTAGCC-3') and SheathRTF (5'-ACATCAGCGTTCGTTTCGG-3') / SheathRTR (5'-CAATCTGGTTAGGTAGGTCG-3') (Takashima Y, et al., 2007; Yoshida M, et al., 2010). The Amplicons were cloned into the pGEM-T vector (Promega) and the plasmids, named respectively as PC-IGC SQ and g91 SQ, were serially diluted and used as the external standard to generate the standard curve in the quantification assay. The assay was performed in 20 μL reaction mixtures containing 2 μL of template and the cycling conditions were: one cycle of 95 ℃ for 30 s, followed by 40 cycles of 95 ℃ for 5 s, 58 ℃ for 10 s, and 72 ℃ for 15 s. All reactions were conducted in triplicate and in the linear response range.
Statistical analyses were performed using the SPSS 17.0 program. The correlation analysis was determined by Spearman's test.
The temperature at the sample sites was recorded and other water-quality parameters, including total phosphorus (TP), chemical oxygen demand (COD), biochemical oxygen demand (BOD5), permanganate index (CODMn), water-quality grades, aggregative trophic level index (TLI), and water nutrition grades in the sampling months in East Lake were obtained from Hubei Environmental Protection Bureau (Table 1). Temperature and TLI in the environment are potential factors that may affect the growth of M. aeruginosa. In our correlation analysis (Table 1), there was no significant correlation (Spearman's r = 0.463) between the temperature and the M. aeruginosa abundance, but there was a positive correlation (Spearman's r = 0.0005) between the TLI and the dynamic changes in M. aeruginosa abundance. A log increase in the number of M. aeruginosa has been linked to the nutrient loading from late winter to early summer.
Sampling date Temperature, ℃ Water-quality grades TLI Water-nutritiongrades Beyond Index 16 May 23 Ⅳ 56.42 Light eutrophication TP, COD, BOD5 14 June 30 Ⅳ 58.24 Light eutrophication TP, COD 16 July 29 Ⅴ 58.42 Light eutrophication TP, COD 30 August 28 Ⅴ 61.43 Moderate eutrophication TP, COD, CODMN 27 September 23 Ⅴ 59.91 Light eutrophication TP, COD, BOD5 11 October 22 Ⅳ 59.91 Light eutrophication TP, COD, BOD5, CODMN 14 November 15 Ⅳ 57.71 Light eutrophication TP, COD 24 December 5 Ⅳ 50.55 Light eutrophication TP 24 January 5 Ⅲ 46.71 Mesotrophication 25 February 10 Ⅲ 46.71 Mesotrophication 25 March 15 Ⅲ 47.71 Moderate eutrophication 26 April 20 Ⅲ 49.55 Moderate eutrophication *BOD5, biochemical oxygen demand; COD, chemical oxygen demand; CODMN, permanganate index; TLI, aggregative trophic level index; TP, total phosphorus. Table 1. Physical and chemical characteristics of water in different months, East Lake
The abundance of M. aeruginosa and Ma-LMM01-type cyanophages in East Lake was monitored for a whole year from late spring 2012 to the early spring in 2013 (Fig. 1B). A dynamic change in PC-IGC copy number of M. aeruginosa was observed. There were 104 copies/mL of the PC-IGC at the beginning of the study in May, 2012. It increased from May and reached the maximum (8.39 × 10⁵ copies/mL) in August, and then declined in September (1.1× 10⁵ copies/mL). During September and October in 2012, the number increased again and reached a small peak at 6.54 × 10⁵ copies/mL in October. The M. aeruginosa abundance decreased from then until February 2013 (5.43 × 10³ copies/mL).
The cyanophage g91 copy numbers detected ranged from 7.16 × 10⁻¹ to 2.53 × 10⁵ copies/Ml throughout the sampling period. The copy number of g91 was hardly detected at the beginning of sampling (May, 2012). The gene copy number consistently increased from June (4.47 × 101 copies/mL) and reached the maximum in August (2.53 × 10⁵ copies/mL), then rapidly declined in September (8.24 × 10² copies/mL), and slightly increased again in October (1.12 × 10³ copies/mL) in 2012. The cyanophage abundance decreased from then until April, 2013 (4.08 × 101 copies/mL). A clear abundance correlation was observed between the host M. aeruginosa and the Ma-LMM01-type cyanophage (Spearman's r = 0.005). We did not observe any time lag between the abundance of Ma-LMM01-type and M.aeruginosa, in contrast to the findings of Yoshiada in 2008 (Yoshida M, et al., 2008). It was revealed that in the natural water environment, the M. aeruginosa population has a high degree of genetic diversity at the intra-species level (Yoshida M, et al., 2008). We used real-time qPCR to examine the PC-IGS genes of M. aeruginosa obtained from the water samples, and found that there were different types of M. aeruginosa in East Lake (data not shown). We speculate that only some of these are susceptible to the specific Ma-LMM01-type phage. In August, there were larger numbers of Ma-LMM01-type phage infecting M. aeruginosa, causing a sharp decrease in the total M. aeruginosa abundace in September. In October, however, the population of M. aeruginosa may have been replaced by another type of M. aeruginosa that is not susceptible to the Ma-LMM01-type cyanophage, resulting in an increase of the total M. aeruginosa abundance in October.
In conclusion, we used the qPCR method to monitor the dynamic changes of Ma-LMM01-type phage and their host M. aeruginosa, revealing that the Ma-LMM01-type phage is an important factor for controlling the M. aeruginosa abundance in East Lake.
HTML
-
We acknowledge financial support from the Knowledge Innovation Program of the Chinese Academy of Sciences (KSCX2-YW-Z-0954, KSCX2-EW-Z-3).
-
HX, MW, TL, and ZS conceived and designed the study. HX and MW performed the experiments and wrote the paper. XG, YW, XY, and YZ, collected the data.


 DownLoad: