


HTML
-
Regulatory T cells (Tregs) have been described to have important functions in the control of the immune system (Sakaguchi S et al, . 1995). On one hand, their suppressive potential is important in the prevention of autoimmune diseases (Kohm A P et al, . 2002)as well as other over-shooting immune reactions. This also plays a role in preventing immunopathology during viral infections (Mills K H, 2004). On the other hand, Treg can play a detrimental role by preventing sufficient anti-tumor responses (Wang H Y et al. 2004; Wang H Y et al. 2004) or immune responses against a pathogen (Mills K H, 2004). The latter scenario can contribute to the establishment of a chronic infection. This has been described for certain viruses such as hepatitis B virus, hepatitis C virus (Furuichi Y et al, . 2005; Manigold T et al, . 2007; Yang J H et al, . 2006) and human immunodeficiency virus-1 (Chevalier M F et al, . 2013; Nilsson J et al, . 2006).
Mice infected with Friend retrovirus (FV) are a useful model for retroviral infections in vivo, and serve as a good system for assessing the contribution of Tregs to chronic infection. We and others have already shown that the cytotoxic CD8+ T cell (CTL) response is suppressed by Tregs in the chronic phase of FV-infection, which contributes to the establishment of a chronic infection (Dittmer U et al, . 2004; Iwashiro M et al, . 2001). In mice, Tregs can be distinguished from conventional CD4+ T helper cells (Tcons) by the expression of the transcription factor forkhead box P3 (Foxp3), which is important for Treg development, maintenance and suppressive activity (Fontenot J D et al, . 2005). We have shown that Foxp3+ Tregs expand significantly during FV-infection in all infected organs (Zelinskyy G et al, . 2009). High viral titers can be specifically detected in the bone marrow and spleen. Interestingly, the infection leads to a massive immune cell infiltration into these organs to combat the virus.
During FV-infection a polyclonal population of Tregs expands; however, a distinct population of T cell receptor (TCR)-Vβ5+ Tregs was recently shown to exhibit disproportionally greater expansion than the bulk of TCR-Vβ5- Tregs (Myers L et al, . 2013). This expansion was caused by the constitutively expressed mouse mammary tumor endogenous retrovirus-9 (mtv-9) superantigen (Sag). It has been described that this Sag binds specifically to the Vβ5+ chain and causes a stimulation of T cells (Choi Y et al, . 1991; Woodland D et al, . 1990). Myers et al. used the FV-model and observed that only Vβ5+ Tregs responded with a disproportionate expansion during the infection, whereas conventional Vβ5+ T cells and Vβ5+CD8+ T cells were not influenced (unpublished observations). Moreover, we showed that the effector CD8+ T cell response is an important factor in triggering this Vβ5+ Treg expansion (Myers L et al, . 2013). Interestingly, the data presented herein demonstrated that the activation of Vβ5+ Tregs was distinct from the bulk of the expanding Tregs during FV-infection, which were Vβ5-. It was shown that the Vβ5+ Tregs exhibited the phenotype of highly activated, short-lived effector cells, whereas Vβ5- Tregs showed less activation and differentiation during FV-infection. Although the Vβ5+ Tregs required tumor necrosis factor α (TNFα) for their expansion, the bulk population of Vβ5- Tregs was strictly dependent on interleukin-2 (IL-2).
We set out to investigate the role of Tregs during acute and chronic FV-infection in mice by characterizing their activation profile and their functional properties. Our data have highlighted that expanding Tregs become activated in the bone marrow and spleen during acute infection, with Vβ5+ Tregs being more activated than Vβ5- Tregs. Tregs were not virus-specific and did not produce cytotoxic molecules, such as Granzyme B (GzmB), or the pro-inflammatory cytokine TNFα. The expansion of Vβ5- Tregs could be triggered by virus-specific CD4+ T cells producing IL-2. Finally, we assessed the expression of inhibitory markers on Tregs during acute FV-infection: blocking of two of these markers, T cell immunoglobulin and mucin protein 3 (TIM3) and programmed death ligand 1 (PD-L1), during chronic infection led to enhanced Treg expansion and activation. This could have important implications for therapies targeting inhibitory markers to enhance T cell responses during infection.
-
Inbred C57BL/6 (B6), DEREG (DEpletion of REGulatory T cells) and EVa3 mice (unpublished mouse strain) kindly provided by George Kassiotis) were maintained at the mouse facility in the University Hospital Essen under pathogen-free conditions. EVa3 mice are doubly transgenic for the TCRα and TCRβ chains of the env122-141-specific CD4+ T cell clone H18 (Young G R et al, . 2012), and will be described in detail elsewhere. Experiments were performed using mice with the relevant FV-resistance genotype; H-2b/b, Fv1b/b, Fv2r/r (B6), or transgenic mice backcrossed on the B6 background. All studies were carried out using female mice aged 8 to 12 weeks at the start of the experiment. All animal experiments were performed in strict accordance with the German regulations of the Society for Laboratory Animal Science (GV-SOLAS) and the European Health Law of the Federation of Laboratory Animal Science Associations (FELASA). Protocols were approved by the North Rhine-Westphalia State Agency for Nature, Environment and Consumer Protection (LANUV) (Permit number: G 1208/11).
-
The FV stock used for all viral infections was a complex containing the B-tropic Friend murine leukemia helper virus (F-MuLV) and the polycythemia-inducing spleen focus-forming virus (SFFV) (Lilly F et al, . 1973). The virus stock was prepared as previously described (Zelinskyy G et al, . 2009). For acute infections, mice were injected intravenously (i.v.) with 20, 000 SFFU of FV. For chronic FV-infections, mice were infected i.v. with 60, 000 SFFU of FV and additionally with 2×10⁵ infectious center assay units of F-MuLV to enhance the chronic viral infection. The virus stocks used in this study did not contain lactate dehydrogenase-elevating virus.
-
For cell surface staining, 3-6×10⁶ spleen or bone marrow cells were re-suspended in FACS buffer containing the required antibodies and stained for 30 min at 4 ℃. The following antibodies were used for the surface staining: α-CD4 (GK1.5, eBioscience), α-CD8 (53-6.7, eBioscience), α-CD25 (PC61.5, BD Bioscience), α-CD69 (H1.2F3, eBioscience), α-CD43 (1B11, BioLegend), MHC class Ⅱ tetramer (I-Ab-estricted FV-specific CD4+ T cell epitope H19-Env, Beckman and Coulter), α-CD11b (M1/70, BD Bioscience), α-CD45.1 (A20, eBioscience), α-Vβ5 (MR9-4, eBioscience), α-TIM3 (8B.2C12, R & D Systems), α-PD-1 (29F.1A12, eBioscience) and α-PD-L1 (10F.9G2, eBioscience). For intracellular cytokine staining, the cells were stimulated for 5 hours at 37 ℃ with 10 µg/mL plate-coated α-CD3 and 2 µg/mL soluble α-CD28 antibodies in the presence of 2 µg/mL brefeldin A. For other intracellular stains, the cells were not stimulated before staining. For intracellular staining protocols, the Foxp3/transcription factor staining buffer set from eBioscience or the BD Cytofix/Cytoperm kit (BD Biosciences) was used. The procedure was carried out according to the manufacturer's instructions. For intracellular staining, the following antibodies were used: α-Foxp3 (FJK-16s, eBioscience), α-Helios (ssF6, BioLegend), α-Ki67 (SolA15, eBioscience), α-BrdU (BU20A, BD Bioscience), α-IL-2 (JES6-5H4, eBioscience), α-TNFα (MP6-XT22, eBioscience), and α-GzmB (GB11, Invitrogen). Flow cytometry data were acquired on an LSRII flow cytometer (BD Biosciences) and the analysis was performed using FlowJo (Treestar) analysis software, where only single live cells were used for analysis.
-
Mice were supplied with 50 mL of water containing 0.8 mg/mL BrdU for three days (refreshed daily) before sacrificing. BrdU incorporation was determined using the BrdU flow kit (BD Biosciences) protocol, as previously described (Zelinskyy G et al, . 2009).
-
For in vivo blockage of the programmed death-1 (PD-1) pathway, 200 µg of rat α-mouse PD-L1 mAb (10F.9G2; BioXCell) was administered four times via the intra-peritoneal (i.p.) route in a three-day interval. To block the TIM-3 pathway, 100 µg of rat α-i-mouse TIM-3 mAb (RMT3-23; BioXCell) were administered four times i.p. in a two-day interval. Both treatments were started 6 weeks post infection.
-
Magnetic bead separation of CD4+ T cells from the lymph nodes and spleen of na ve EVa3 transgenic (EVa3tg) or EVa3 wild type (EVa3wt) mice was performed using the CD4+ T cell isolation kit Ⅱ (Miltenyi Biotec) according to the manufacturer's instructions. The purity of isolated CD4+ T cells assessed by FACS was greater than 80%. 5×10⁶ cells were then transferred into infected mice (4 days post infection (dpi)) by i.v. injection and the mice were sacrificed at 7 dpi.
-
Statistical analysis and data presentation were performed using GraphPad Prism software. All data sets were first tested for normality using the D'Agostino and Pearson omnibus normality test. Data were then assessed using either parametric one-way analysis of variance (ANOVA) or non-parametric Kruskal-Wallis test. Statistical significances were calculated using the Bonferroni post-test (parametric) or the Dunn's post-test (non-parametric) assessment methods. When only two groups were analyzed, data was tested using a parametric or non-parametric Student's t-test.
Mice
Virus stock and infection
Cell surface and intracellular staining using flow cytometry
Bromodeoxyuridine (BrdU) labeling of mouse cells via drinking water and BrdU staining
Antibody treatment of infected mice
CD4+ T cell transfer
Statistical analysis
-
The Ikaros transcription factor Helios was described as a marker for natural Tregs (nTregs) (Sugimoto N et al., 2006; Thornton A M et al., 2010), although it is now believed to be more of an activation marker of Tregs (Gottschalk R A et al., 2012). Tregs have been shown to expand in several organs of FV-infected mice (Akimova T et al., 2011; Verhagen J et al., 2010). To compare the expansion kinetics of activated Tregs in two organs after FV-infection (Zelinskyy G et al, . 2009), the numbers of CD4+Foxp3+Helios+ T cells in the bone marrow and the spleen were investigated. Activated Tregs expanded in both organs during the acute infection, with peak expansion at 12 to 14 dpi. Elevated levels of activated Tregs remained in the late acute (21 dpi) and chronic (40 dpi) phases of virus infection (Figure 1). As expected, much greater numbers of activated Tregs were present in the spleen than in the bone marrow. Interestingly, we observed a much higher Treg to Tcon ratio in the bone marrow than in the spleen (38.5±6% for the bone marrow vs. 17.7±5% in the spleen at peak expansion). In conclusion, Tregs become activated during FV-infection and undergo a large expansion in the spleen and bone marrow, and the level of activated Tregs remains elevated throughout chronic FV-infection in the spleen.
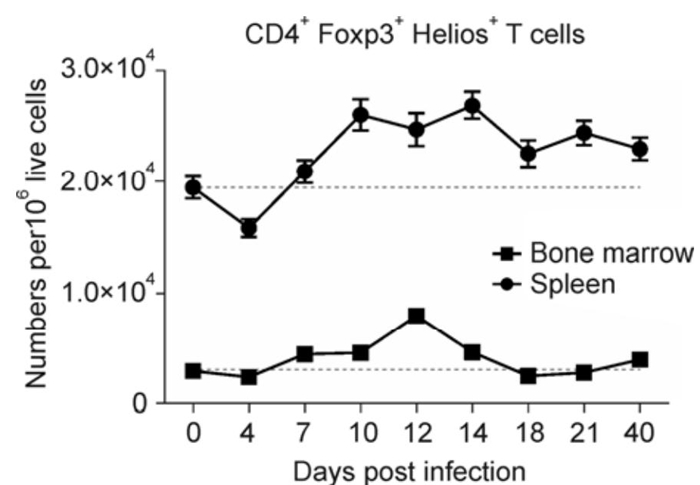
Figure 1. Time course of Treg expansion in the spleen and bone marrow of FV-infected mice. C57BL/6 mice were infected with FV and the spleens and the bone marrow were analyzed by flow cytometry for the numbers of CD4+ Foxp3+ Helios+ T cells per 1×10⁶ lymphocytes at the depicted time points post infection. For each organ, the level of CD4+ Foxp3+ Helios+ T cells is indicated by a dotted line for comparison. The mean and standard error of the mean (SEM) are shown.
-
Recently we described a special subset of Tregs that expands during FV-infection (Myers L et al, . 2013). These Tregs are Vβ5+, specific for the endogenous Sag of mtv-9 and expand disproportionally more than Tregs not expressing Vβ5 (Myers L et al, . 2013). This Vβ5+ Treg subset also shows the phenotype of terminally differentiated, short-lived effector cells. To assess these two Treg populations in more detail, expression analysis of a set of activation markers was performed.
CD69 is an early activation marker of T and NK cells and becomes up-regulated when these cells are activated. A higher percentage of Tregs were positive for CD69 compared with Tcons in both organs (Figure 2A). Interestingly, in the bone marrow a higher percentage of Vβ5+ Tregs positive for CD69 was detected, compared to Vβ5- Tregs, whereas no significant differences were seen in the spleen for this marker (Figure 2A). The activation-induced glycosylated isoform of CD43 was also expressed on both Tregs and Tcons, with a higher percentage of CD43+ Tregs than CD43+ Tcons, but this was only observed in the spleen (Figure 2B). Similar results were obtained for CD103 expression. CD103 is an integrin protein important for T cell homing to intestinal sites. Tregs of FV-infected mice showed a higher percentage of CD103 when compared to Tcons (Figure 2C). Interestingly, the expression of CD43 and CD103 was elevated on Vβ5+ Tregs compared to Vβ5- Tregs in both organs, highlighting the increased activation status of Vβ5+ Tregs. It is noteworthy that the activation level of Tregs measured by the expression of CD69, CD43, and CD103 was higher in the bone marrow than in the spleen during acute FV-infection (Figure 2A-C, compare left (spleen) to right (bone marrow) for Vβ5+ and Vβ5- Treg subsets from infected mice). Other activation markers that are frequently used to characterize activated Tcons, such as CD44 or CD62L, were not differently expressed between Tregs from na ve mice and from FV-infected mice (data not shown). Thus, these markers are not useful to define activated Tregs in FV-infection.
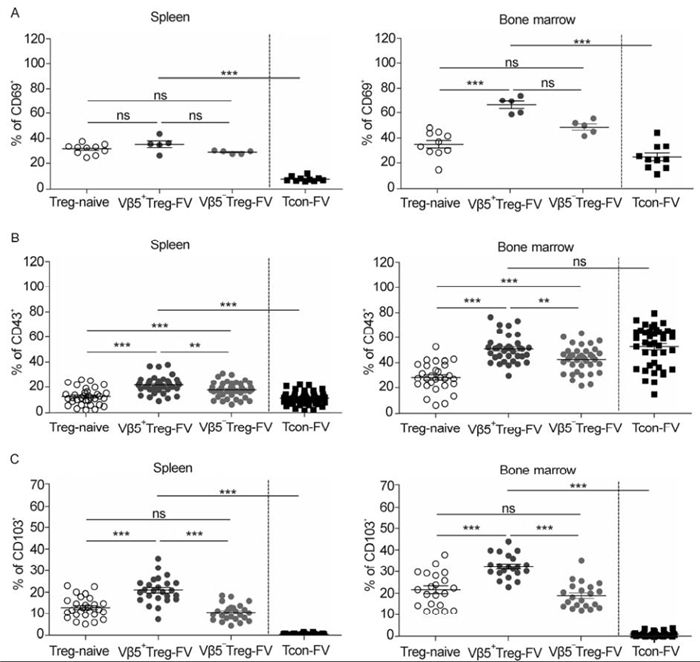
Figure 2. Expression of activation associated markers on subpopulations of Tregs in FV-infected mice. Flow cytometry was used to quantify activation markers in the spleen and bone marrow of 12-day FV-infected mice. The frequencies of CD4+ Foxp3+ Treg populations and CD4+ Foxp3- Tcons in the spleen (left) and the bone marrow (right) expressing (A) CD69+ cells, (B) CD43+ cells, and (C) CD103+ cells were enumerated and expressed as a percentage of the depicted Treg population. Mice from at least three different experiments were pooled; each dot represents an individual mouse. For statistical analysis, either a one-way ANOVA (comparison of the three Treg groups) or a t-test (comparison of Tregs and Tcons) was used. Statistical significance is indicated by asterisks (ns not significant; * < 0.05; ** < 0.005; *** < 0.0005). The bars display mean and SEM.
Next, the proliferation profile and expression of Bcl2 (B-cell lymphoma 2), as a pro-apoptotic marker, in Tregs was investigated. Mice were fed with BrdU, and the incorporation of BrdU into the DNA of dividing cells was assessed. Tregs had undergone more proliferation than Tcons in both organs after FV-infection, with a higher percentage of dividing cells for Vβ5+ Tregs compared to Vβ5- Tregs (Figure 3A and B). Interestingly, the frequency of BrdU+ Tregs was higher in the bone marrow than in the spleen, reflecting the higher immune cell activation in this organ. Similar results were obtained for Ki67, a marker only expressed during the active stages of the cell cycle (data not shown). When stained for the anti-apoptotic marker, Bcl2, it was observed that activated Tregs and Tcons down-regulated Bcl2 in the spleen after FV-infection (data not shown). This implies a higher susceptibility of activated T cells to apoptosis in the spleen of infected mice. Taken together, Tregs show higher activation and proliferation than Tcons in the bone marrow and spleen, with Vβ5+ Tregs displaying the most activated phenotype.
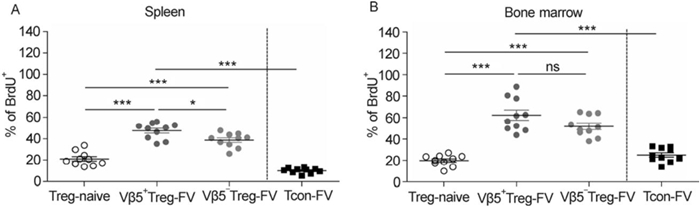
Figure 3. Proliferation of Vβ5+ Tregs compared to Vβ5- Tregs and Tcons in infected mice. Mice were infected with FV for 12 days and treated with BrdU to observe cell proliferation. Flow cytometry was used for detection of BrdU incorporation into CD4+ Foxp3+ Treg populations and CD4+ Foxp3- Tcons in the spleen (A) and bone marrow (B). Mice from at least two different experiments were pooled; each dot represents an individual mouse. The bars represent the mean and SEM. For statistical analysis, either a one-way ANOVA (comparison of the three Treg groups) or a t-test (comparison of Tregs and Tcons) was used. Statistical significance is indicated by asterisks (ns not significant; * < 0.05; *** < 0.0005).
-
It is has been reported for some virus infections that virus-specific Tregs exist, although their numbers are quite low (Bedoya F et al, . 2013; Ebinuma H et al, . 2008; Piersma S J et al, . 2010). We therefore analyzed whether or not the expanding Tregs during FV-infection are virus-specific. We made use of the MHC class Ⅱ tetramer technology, utilizing an immunodominant FV-specific CD4+ T cell epitope (I-Ab-restricted CD4+ T cell FV H19-Env epitope). As bone marrow Tregs showed the highest level of activation, in comparison to splenic Tregs, Foxp3+ bone marrow Tregs from na ve and infected Foxp3 reporter mice (GFP+) were stained with MHC class Ⅱ tetramers. We were unable to detect any MHC class Ⅱ tetramer+ Tregs in na ve as well as infected mice, whereas MHC class Ⅱ tetramer+ Tcons were readily detectable in acutely infected mice (Figure 4A and B). In conclusion, it was found that the Treg population expanding during FV-infection is non-specific against an immunodominant epitope.
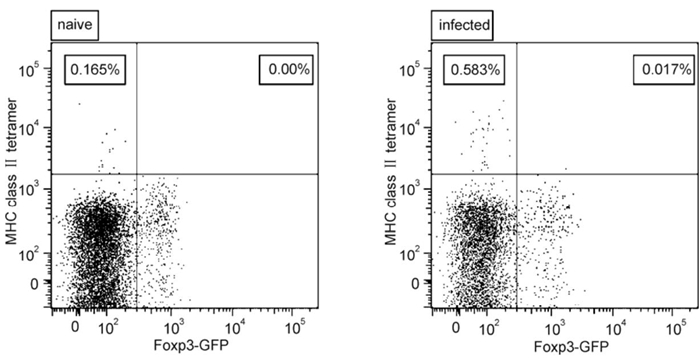
Figure 4. The specificity of CD4+ T cells (Foxp3+ and Foxp3-) to an immunodominant epitope of FV. Flow cytometry was used to analyze bone marrow from 10-day FV-infected mice. CD4+ T cells were examined for their expression of Foxp3 and MHC class Ⅱ tetramer. Representative scatter plots of MHC class Ⅱ tetramer against Foxp3 are shown from a na ve mouse and an infected mouse.
-
We have previously shown that Vβ5+ Treg expansion is IL-2 independent, whereas Vβ5- Tregs require IL-2 (Myers L et al, . 2013). To determine whether this IL-2 is produced by Tcons during acute FV-infection, we transferred CD4+ T cells from FV-specific CD4+ TCR transgenic (tg) or wildtype (wt) EVa3 mice into FV-infected animals. The transfer was carried out at 4 dpi and the analysis at 7 dpi, before Tregs had expanded, to ensure that only transferred but not endogenous CD4+ T cells trigger Treg expansion. In infected recipient mice, the CD4+ TCR tg cells recognized their cognate FV-antigen and expanded in the spleen, whereas CD4+ T cells from non-tg littermates did not expand (Figure 5A). The CD4+ TCR tg cells mediated an expansion of endogenous Vβ5- Tregs, whereas the population of endogenous Vβ5+ Tregs was unaltered (Figure 5B). Furthermore, TCR tg CD4+ T cells produced IL-2 after transfer, in contrast to transferred CD4+ cells from non-transgenic EVa3 wildtype mice (Figure 5C). The expansion of Vβ5- Tregs was most likely to be a direct effect of the transferred TCR tg CD4+ T cells, as no changes in IL-2 production in the endogenous population of CD4+ or CD8+ T cells were observed after transfer (Figure 5D and E). In summary, the results suggest that the IL-2 that is required for the expansion of the Vβ5- Tregs is produced by virus-specific Tcons.
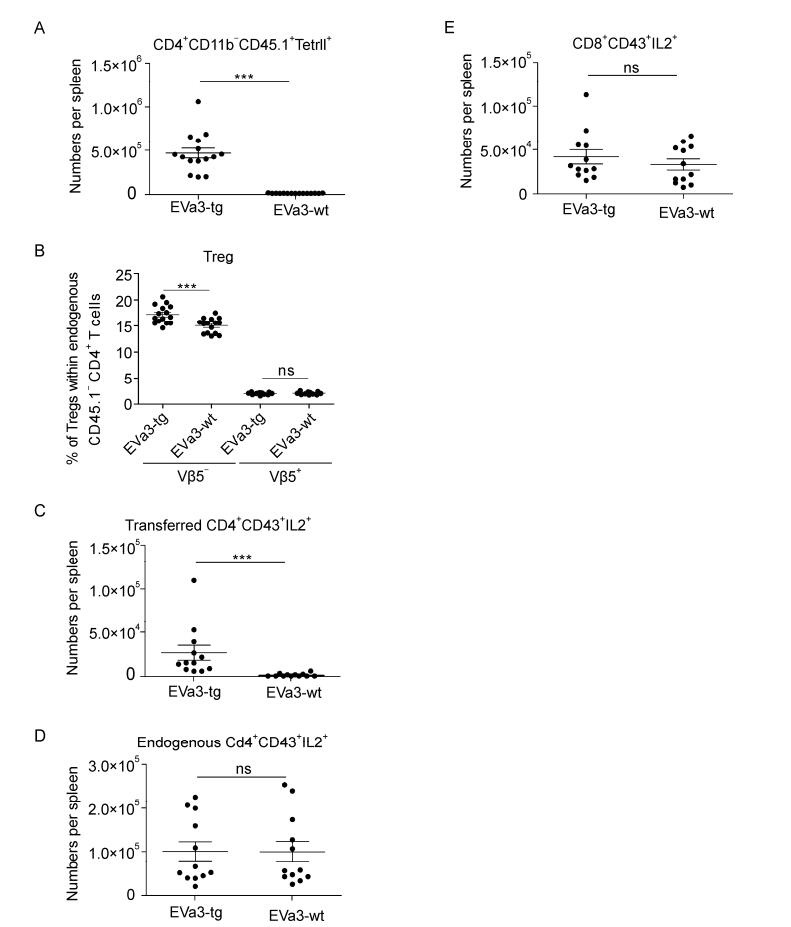
Figure 5. Response of Vβ5- and Vβ5+ Tregs after transfer of virus-specific CD4+ T cells producing IL-2. Mice were infected with FV for 7 days. 5×10⁶ magnetic bead isolated CD4+ T cells from either na ve EVa3tg (expressing an elevated repertoire of FV-specific CD4+ T cells) or EVa3wt mice were transferred into infected mice 4 dpi, and the organs were analyzed 7 dpi using flow cytometry. (A) The numbers of MHC class Ⅱ+ CD4+ CD11b- transferred (CD45.1+) cells in the spleen were determined. (B) Relative expansion of Vβ5+ and Vβ5- endogenous (CD45.1-) Tregs when either virus-specific or non-specific cells were transferred. The numbers of IL-2 expressing (C) activated transferred CD4+ T cells, (D) activated endogenous CD4+ T cells or (E) activated CD8+ T cells were measured. Mice from three different experiments were pooled; each dot represents an individual mouse. The bars represent mean and SEM. For statistical analysis, a t-test was used (ns not significant and *** < 0.0005).
-
To further characterize Treg function during FV-infection, the production of GzmB and the cytokine TNFα was investigated in Tregs from the bone marrow. The bone marrow was chosen, as this organ contains T cells with the highest levels of activation during FV-infection (Figure 2 and data not shown). Tregs are able to secrete GzmB (Akhmetzyanova I et al, . 2013). During the acute FV-infection CD8+ T cells are potent producers of GzmB (Zelinskyy G et al., 2006), whereas Tcons only showed a minor increase in GzmB production (Figure 6A). In contrast, Tregs did not produce any GzmB during acute FV-infection (Figure 6A). To analyze whether Tregs produce a predominant pro-inflammatory cytokine during acute FV-infection, intracellular TNFα staining was performed. High numbers of CD8+ T cells and CD4+ Tcons producing TNFα were detected during FV-infection (Figure 6B). However, Tregs did not stain positive for TNFα during FV-infection (Figure 6B). Thus, in contrast to effector T cells, Tregs do not produce pro-inflammatory cytokines or cytotoxic molecules at peak Treg expansion and activation.

Figure 6. Production of GzmB and TNFα during acute FV-infection by different T cells. Flow cytometry was used to quantify GzmB and TNFα production in the bone marrow of 10-day FV-infected mice. (A) GzmB expression in activated (CD43+) cells and (B) TNFα+ cell numbers were analyzed via intracellular staining of bone marrow cells. The results of two independent experiments are shown. The bars represent mean and SEM. For statistical analysis, a t-test was used (ns not significant; * < 0.05 and *** < 0.0005).
-
The expression of inhibitory molecules on T cells such as TIM3, PD-1 and PD-L1, are known to mediate immunosuppressive functions. PD-1 is a negative regulator of T cell proliferation and activation and mediates suppressive functions after binding to its ligands PD-L1 or PD-L2 (Barber D L et al, . 2006; Blackburn S D et al, . 2009). TIM3 is an inhibitory molecule mainly observed on Tcons, which mediates cell death upon ligation (Jones R B et al, . 2008). Interestingly, Tregs expressed three of these inhibitory markers on their surface (PD-L2 was not tested), and even showed an up-regulation during acute FV-infection, a phenotype which was also observed for Tcons (Figure 7A-C). Furthermore, it was found that the frequency of Tregs and Tcons expressing these markers was enhanced in the bone marrow compared to the spleen during acute FV-infection (Figure 7A-C). Therefore, similar to effector T cells, Tregs up-regulate inhibitory receptors and ligands during acute FV-infection.
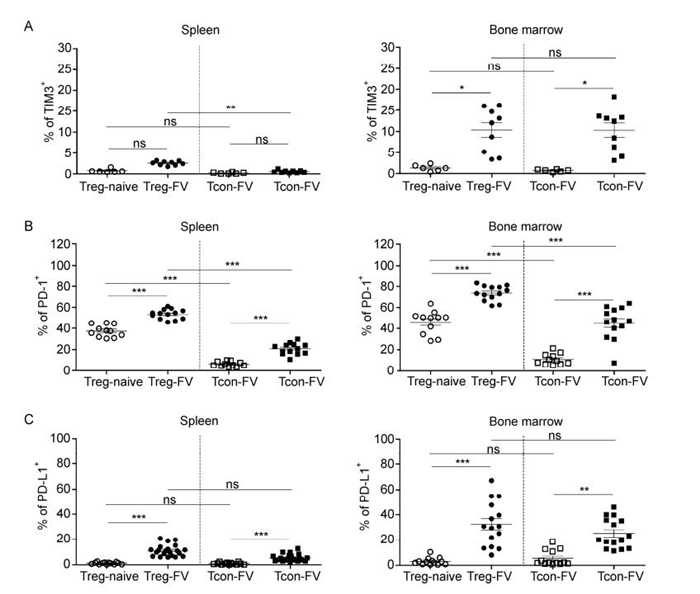
Figure 7. Expression of inhibitory markers on Tregs and Tcons during acute FV-infection. Flow cytometry was used for analysis of the expression of inhibitory markers in the spleen and in the bone marrow of 12-day FV-infected mice. The frequencies of CD4+ Foxp3+ Tregs and CD4+ Foxp3- Tcons in the spleen (left) and bone marrow (right) are presented. (A) TIM3+ cells, (B) PD-1+ cells and (C) PD-L1+ cells were enumerated and expressed as a percentage of the depicted cell population. Mice from at least three different experiments were pooled; each dot represents an individual mouse. The bars represent mean and SEM. For statistical analysis, either a one-way ANOVA (comparison of the three Treg groups) or a t-test (comparison of Tregs and Tcons) was used. Statistical significance is indicated by asterisks (ns not significant; * < 0.05; ** < 0.005; *** < 0.0005).
-
CD8+ T cells become dysfunctional during the chronic phase of FV-infection and express inhibitory markers, such as TIM3 and PD-1. The treatment of chronically infected mice with α-PD-L1 and α-TIM3 has been shown to have beneficial effects on CD8+ T cell responses (Dietze K K et al, . 2013), which may help to reduce chronic viral loads. However, the effect of this treatment on Tregs has not been addressed so far, although both PD-1 and TIM3 were expressed on Tregs (Figure 7A and B). Mice were chronically infected with FV followed by treatment with α-PD-L1 and α-TIM3 antibodies at 6 weeks post infection. Immune responses in the spleen were investigated based on the earlier observation that in chronic infection the virus loads were higher in the spleen than the bone marrow (Zelinskyy G et al, . 2009). Treg numbers significantly increased when mice were treated with α-PDL-1 or α-PDL-1 plus α-TIM3 (Figure 8A). The numbers of Tregs expressing CD43 also increased during the treatment with α-PD-L1 and α-PD-L1 plus α-TIM3 antibodies (Figure 8B). This suggests that inhibitory receptors influence not only effector T cells functions but also the activation and expansion of Tregs.
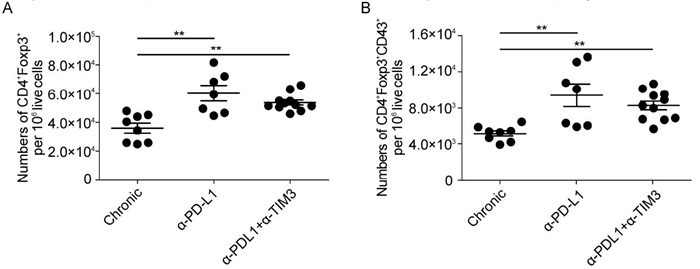
Figure 8. Expansion and activation of Tregs after the block of PD-L1 and TIM3 during the chronic phase of infection. Mice were chronically infected with FV and treated with blocking antibodies against PD-L1 and TIM3, as indicated. (A) Numbers of Tregs and (B) activation of Tregs (CD43+) were determined in the spleen using flow cytometry. Mice from at least three different experiments were pooled; each dot represents an individual mouse. The bars represent mean and SEM. For statistical analysis, a one-way ANOVA was used. Statistical significance is indicated by asterisks (* < 0.05; ** < 0.005).
Activated Tregs expand in the bone marrow and the spleen during FV-infection and remain at elevated levels during chronic infection
Treg activation is high in FV-infected organs
Tregs expanding during FV-infection are not specific for an immunodominant CD4+ T cell epitope
The expansion of Vβ5- Tregs is driven by virus-pecific CD4+ Tcons
Tregs do not produce cytokines or cytotoxic molecules during acute FV-infection
Tregs up-regulate inhibitory receptors during acute FV-infection
Blocking PD-L1 and TIM3 during the chronic phase of FV-infection enhances Treg expansion and activation
-
In this study, we have shown that Tregs expand in the spleen and bone marrow during acute FV-infection and that the cells displayed an activated phenotype with significant proliferation. Interestingly, the bone marrow contained a much higher ratio of Tregs to Tcons than the spleen during acute infection, but the overall number of Tregs present in the bone marrow was much lower than in the spleen. The activation of Tregs after virus infections has been described, but the mechanisms of activation are not fully understood (Bedoya F et al, . 2013; Presicce P et al., 2011; Sanchez A M et al, . 2012). Recently, we described two subsets of activated Tregs expanding during FV-infection, Vβ5+ and Vβ5- Tregs (Myers L et al., 2013). Vβ5+ Tregs are mtv-9 Sag specific and expand in response to TNFα produced by effector CD8+ T cells rather than to virus antigen. Another population, Vβ5- Tregs, is not Sag specific and independent of TNFα and CD8+ T cells. In this study, we confirmed that FV-induced Tregs are not FV-specific, indicating that viral antigen does not drive their proliferation. However, the Vβ5- Treg subset requires IL-2 for their activ ation and proliferation. IL-2 is an important survival factor for Tregs and other T cells, but is not itself produced by Tregs (Barron L et al, . 2010; Malek T R, 2003; Scheffold A et al, . 2005). This study shows that the IL-2 driving the Vβ5- Treg activation and expansion is produced by virus-specific CD4+ Tcons, which respond to the infection. This IL-2 production has beneficial effects for the anti-viral immune response, on the one side, as it is an important survival factor for Tcons and CD8+ T cells (Kryworuchko M et al, . 2006). On the other side it also drives activation and expansion of Tregs, which in turn suppress anti-viral immune responses. Furthermore, it has been described that IL-2, IL-2Rα, and IL-2Rβ deficient mice develop a strong lymphoproliferative syndrome and suffer from severe autoimmunity because of impaired Treg responses (Sadlack B et al, . 1993; Suzuki H et al, . 1997; Willerford D M et al, . 1995) rather than immune dysfunction due to activation deficiency of Tcons. In conclusion, IL-2 is a factor that induces a fine balance between immune activation and suppression during an ongoing infection. Thus, blocking IL-2 during infectious diseases might be an effective therapeutic approach to inhibit activation and expansion of Tregs.
Comparison of the Treg subsets, with regard to their activation in the two organs, revealed stark differences. Vβ5- Tregs from infected mice appeared to be less activated than Vβ5+ Tregs from infected mice in both organs when the expression of CD43 and CD103 were quantified. In the spleen, Vβ5+ Tregs proliferated more than Vβ5- Tregs from infected animals. The stark activation of Vβ5+ Tregs was shown in an LCMV infection model (Punkosdy G A et al, . 2011) and when the FV-model was used (Myers L et al, . 2013). Sag stimulation has been shown to induce Tregs and to activate them (Taylor A L et al, . 2010). This could provide an explanation for the high activation of Vβ5+ Tregs. Tregs expanding in FV-infection are nTregs (Antunes I et al, . 2008; Myers L et al, . 2013)and not specific for an immunodominant epitope of CD4+ Tcons in FV-infection. Furthermore, Treg activation was higher than activation of Tcons in both organs, except for CD43 in the bone marrow. Tregs also showed higher proliferation compared to Tcons in FV-infected mice. Interestingly, these effects were already seen when na ve Tregs and Tcons were compared (data not shown), hinting towards a pre-activation of Tregs. Indeed, nTregs, which directly arise from the thymus, are self-reactive and recognize self-antigens (Cabarrocas J et al, . 2006; Coquet J M et al, . 2013; Coutinho A et al, . 2005; Leavy O, 2013). Resulting from this, nTregs are constantly exposed to their specific antigen in circulation and thus nTregs are activated at a low level (Killebrew J R et al, . 2011). In conclusion, activated and expanded Tregs are not specific for viral proteins during acute FV-infection. Vβ5+ Tregs are mtv-9 Sag specific and become activated via TCR stimulation mediated by Sag cross-linking MHC Ⅱ and the TCR-Vβ5 chain (Woodland D L et al, . 1993). As a second signal for proliferation and differentiation, these cells require TNFα (Myers L et al, . 2013). By contrast, the specificity of the Vβ5- Treg subset remains to be defined. These cells do receive a TCR signal of unknown origin (unpublished observations) and need IL-2 as a secondary signal for full activation and expansion.
Thus far, no mechanism for Treg-induced immune suppression during FV-infection has been shown, but a few possibilities can be excluded. Tregs in FV-infection do not mediate suppression via the secretion of IL10 (Dittmer U et al, . 2004; Iwashiro M et al, . 2001), and only minor effects were observed when transforming growth factor β (TGF-β) was blocked in an in vitro assay system (Robertson S J et al, . 2006). However, Robertson et al. (2006) showed that Tregs suppress FV-specific CD8+ T cells in an in vitro system in a cell-contact dependent, APC-independent manner, without IL-10 and TGF-β being involved. The cytotoxic T-lymphocyte antigen 4 appears to play some role for Treg-mediated suppression (Iwashiro M et al, . 2001). All these effects were shown in an in vitro assay and cannot directly be extrapolated to the FV-infection model, since the behavior of Tregs in vivo can be very different from that in vitro. GzmB is a serine protease that can, with the help of perforin, kill cells in close proximity and has been shown to be produced by Tregs in an FV in vivo tumor model (Akhmetzyanova I et al, . 2013). CD8+ T cells are potent producers of GzmB during FV-infection (Zelinskyy G et al, . 2006) and Tcons are able to produce low amounts of this cytokine, although Tregs do not. TNFα, a cytokine that can mediate apoptosis in adjacent cells, is also produced by CD8+ T cells and Tcons during FV-infection, but again not by Tregs.
Finally, we investigated the expression of inhibitory markers on Tregs during acute FV-infection. An up-regulation for all the markers investigated (TIM3, PD-1 and PD-L1) was seen for both Tregs and Tcons. The detection of elevated levels of these inhibitory molecules on Tregs argues towards a role in Treg biology. In a systemic model of murine acute myeloid leukemia, Treg-mediated suppression of CD8+ T cells was dependent on the expression of PD-1 on Tregs (Zhou Q et al, . 2010). Furthermore, Tregs that express PD-1 and TIM3 are highly suppressive (Sakuishi K et al, . 2013). Interestingly, Francisco et al. (2009) showed that PD-L1 is important for the function of induced Tregs (Francisco L M et al, . 2009). We have investigated the effect of antibodies directed to TIM3 and PD-L1 to use in chronic FV-infection. Treatments with these antibodies have been described to boost CD8+ T cell responses and lower viral titers (Barber D L et al, . 2006; Li W et al, . 2011; Palmer B E et al, . 2013). When mice were treated with the two blocking antibodies, Treg numbers were increased and elevated numbers of activated Tregs were observed. These Tregs are possibly memory Tregs, which can be re-activated when CD8+ and CD4+ Tcons become re-activated during antibody treatment. Sanchez et al. have shown that memory Tregs exist in viral infections and expand rapidly upon secondary challenge (Sanchez A M et al, . 2012). The blocking of two molecules which are associated with inhibitory functions on CD8+ T cells and Tcons is likely to have a similar effect on Tregs as for other subsets of T cells. Consequently, Tregs that might be restricted in their activation due to TIM3 and PD-1 expression during chronic FV-infection can be further stimulated when PD-L1 and TIM3 are blocked. Whether the expanding Tregs are more suppressive than Tregs from untreated mice remains to be investigated. The data presented here have shown that inhibitory molecules expressed by Tregs and other T cells could make novel targets for therapeutics, aiming at re-awakening the immune system during chronic viral infections and thereby reducing chronic viral titers. However, the activation of Tregs has to be considered as a potential threat to Tcon and CD8+ T cell activation and therapies have to be designed according to this insight.
-
This work was supported by the German Research Association (DFG) Transregio 60 project B4 and DI 1914/1-1 (www.dfg.de) as well as a graduate school grant given to JJJ as part of the GK1045 funding provided by the DFG. The funders had no role in study design, data collection and analysis, decision to publish, or preparation of the manuscript.
-
JJJ performed the experiments, collected and analyzed the data and wrote the paper. KKD performed the experiments and collected the data. GZ collected and analyzed the data. UD conceived and designed the study and wrote the paper. All authors read and approved the final manuscript.


 DownLoad: