


HTML
-
Dengue virus (DENV) is one of several globally important arthropod-borne pathogens within the genus Flavivirus. Dengue infection occurs mainly in tropical and sub-tropical countries in Southeast Asia, the Pacific, and the Americas. In recent decades, the annual average incidence of dengue infections has increased dramatically; worldwide, it is estimated that there are over 100 million cases annually, leading to ~500, 000 hospitalizations with a case fatality rate of 5% (Kyle J, 2008; WHO, 2012). There are four antigenically distinct serotypes (DENV-1, -2, -3, and -4), and epidemiological studies over a 20-year period have determined that DENV-2 is the most prevalent serotype (Hoang L, 2010; Vaughn D, 2000). Until recently, the pathogenic mechanism and the interactions between DENV and host factors have been incompletely understood.
The genome of DENV is a positive single-stranded RNA of approximately 11 kb in length, which contains a single open reading frame that codes for three structural proteins (capsid [C], membrane [M], and envelope [E]) and seven non-structural proteins (NS1, NS2A/B, NS3, NS4A/B, and NS5). The NS1 protein is a highly conserved 46-kDa glycoprotein, containing 12 highly conserved cysteine (Cys) residues that form 6 intermolecular disulfide bonds, and 2 N-linked glycosylation sites (Chambers T, 1990). NS1 is co-translationally translocated into the endoplasmic reticulum (ER) lumen by the trans-membrane signal sequence at the C-terminus of the E protein (Mackenzie J, 1996; Pryor M, 1994; Westaway E, 1997). The glycosylation status of NS1 is important for its polymerization and distribution, which occurs in the ER lumen, and further modification occurred in the Golgi network where a complex-type sugar is added to the N130 glycan but the N207 glycan is retained in the high mannose (Falgout B, 1995; Pryor M, 1994; Winkler G, 1988). It has been found that NS1 localizes within the ER membrane, f orms a homodimer which is required for transport through the Golgi and a partially hydrophobic nature keeps NS1 stay membrane associated. NS1 also can stay within c ellular vesicular compartment before attaching to the cell surface and then finally being secreted from mammalian cells, predominantly as a hexamer (Flamand M, 1999; Pryor M, 1994; Winkler G, 1989). NS1 can be detected in the sera of infected patients (up to 50 μg/mL), with higher levels being present in those who developed dengue hemorrhagic fever (DHF) rather than dengue fever (DF), indicating that secreted NS1 may contribute to the severity of infection in patients (Alcon S, 2002; Young P, 2000). During dengue infection, NS1 can elicit a strong humoral immune response, enhance infection in hepatocytes, and promote endothelial cell damage by facilitating immune complex formation (Avirutnan P, 2006; Chang H, 2002; Lin C, 2003; Sun D, 2007). It can also antagonize complement activation by binding factor H, and also C4 and C1s, thereby depressing complement activation and protecting DENV from direct complement-dependent neutralization (Avirutnan P, 2010; Chung K, 2006; Fuchs A, 2010).
The conservation of 12 Cys residues suggests that these residues are important in NS1 multimerization and function. It has been proposed that mutations of glycosylation sites and conserved Cys residues are associated with decreased virus growth, reduced plaque size, delayed cytopathic effect, and impaired NS1 secretion (Pryor M, 1993; Pryor M, 1994). However, the effects of the mutations that were examined by different groups appeared to be inconsistent in cell culture (Tajima S, 2008); and the deglycosylation of N-linked sites leads to diverse phenotypes with respect to mouse neurovirulence, following flavivirus infection (Muylaert I, 1996; Pletnev A, 1993; Pryor M, 1998; Whiteman M, 2010). A previous study also indicated that the C-terminal end of the protein is important in NS1 dimer formation (Pryor M, 1993).
Because the effect of NS1 on viral replication and virulence remains unclear, we investigated the functions of th e Cys residues and of the C-terminal of NS1 in the viral life cycle. In the present study, we demonstrate that an alanine mutation at Asn-207 delays viral replication and the cytopathic effect, and leads to reduced plaque size. Th ree Cys-site mutations and a C-terminal deletion (ΔC) each completely abolish viral growth and replication, whereas mutations at Asn-130 and Glu-173 lead to a phenotype that is similar to that of the WT virus. The res ults provide valuable insights into the role of NS1 in viral infection and could guide the development of novel antiviral therapies for dengue patients.
-
BHK-21 (Baby hamster kidney) and Vero (African green monkey kidney) cells (Invitrogen, Carlsbad, CA, USA) were propagated in Dulbecco's modified Eagle's medium (DMEM, Gibco, Grandisland, NY), supplemented with 10% (w/v) fetal bovine serum (FBS) and 100 U penicillin-streptomycin/mL, in 5% (v/v) CO2 at 37℃. Stocks of DENV-2 viruses were grown in Vero cells with 2% (w/v) FBS, and the viral titer was calculated with plaque assays on BHK-21 cells.
-
DENV-2 genome-length cDNA infectious clones containing various mutations were constructed by using a modified pAC Y C-DENV2-TSV-f1 vector (Lin S, 2011). A recombinant Renilla luciferase-reporting replicon, pACYC-TSV-Rluc2A-Rep, was used to construct mutative replicons for viral replication analysis. Dr. Pei-Yong Shi provided all of the original vectors (Novartis Institute for Tropical Diseases, Singapore). NS1 mutations (C4A, C55A, C291A and N130A, N207A) and a ΔC were obtained by standard overlap-polymerase chain reaction (PCR). The overlap-PCR fragments were inserted into the DENV-2 TSV01 infectious clone and replicon using two unique restriction enzymes, Bsr GI (nucleotide position 2103) and Mlu Ⅰ (nucleotide position 4571). All constructs were verified by DNA sequencing.
-
The infectious cDNA clones were linearized with Cla Ⅰ. The genome-length and replicon RNAs were produced with linearized cDNA using a mMESSAGE mMACHINE T7 kit (Ambion, TX, USA), according to the manufacturer's instructions. Approximately 5 μg RNAs were transfected into BHK-21 cells (8×10⁶)in 0.8 mL cold phosphate-buffered saline (PBS, pH 7.5) by electroporation using a Gene pulser apparatus (Bio-Rad, Hercules, CA, USA). A setting of 0.85 kV and 25 μF was used, pulsing three times at 3-s intervals, followed by a 10-min recovery period at room temperature. The transfected cells were diluted in 25 mL DMEM containing 10% (w/v) FBS, and were then incubated in a T-75 flask for 5-7 d under 5% (v/v) CO2, at 37℃; (Jia F, 2013).
-
Approximately 3×10⁵ Vero cells were seeded onto slides in a 6-well plate and then infected with WT and mutant viruses at a multiplicity of infection (MOI) of 0.1. At 24-h post-infection in 5% (v/v) CO2 at 37℃, the cells were fixed using 5% (v/v) cold (-20℃) acetic acid in methanol for 10 min. The fixed cells were washed three times in PBS and incubated with primary monoclonal antibody against St. Louis encephalitis virus (SLEV) envelope protein (cross-react ive to DENV-2 envelope; MAB8744; Millipore, Billerica, MA, USA) at a dilution of 1:250 for 1 h at 37℃. After being washed three times in PBS, the cells were incubated with Texas Red–conjugated Affinipure Goat Anti-Mouse IgG (1:100 diluted, Proteintech) for 1 h at room temperature. The slides were again washed three times in PBS, mounted in 95% (v/v) glycerol and then examined under a Leica TCG-S P2 Laser Scanning Confocal Microscopy (Leica, Wetzlar, Germany).
-
Serial 1:10 dilutions were made by mixing 15 μL viral stocks with 135 μL DMEM containing 10% (w/v) FBS. For each dilution, 100 μL was seeded in an individual well of a 24-well plate, containing sub-confluent BHK cells. After 1 h incubation under 5% CO2 at 37℃, the cells were overlaid with DMEM plus 2% (w/v) FBS, and 1% (w/v) methylcellulose (Aquacide Ⅱ, Calbiochem, San Diego, CA, USA). Following 4 d of incubation at 37℃ under 5% CO2, the cells were fixed with 3.7% (w/v) formaldehyde and stained with 1% (w/v) crystal violet. Viral titers were calculated as the number of plaque-forming units (PFU) per μL.
-
BHK-21 cells were transfected with mutant and WT RNAs. The transcribed RNAs from DENV2 TSV01 cDNA clones were prepared as above. To detect the mutants without obvious cytopathic infection (CPE), the cell supernatants were collected as P0 at 96 -h post-transfection (p.t.). P0 supernata nts were used to infect fresh BHK-21 cells and passaged accordingly after 4 days. Total RNAs were extracted from 200 μ L viral stocks and cell suspensions with a TRIzol kit (Invitrogen, Carlsbad, CA, USA) according to the manufacturer's instructions. The RNA was resuspended in 10 μL RNAsefree distilled water and stored at -80℃. RNA copy numbers were calculated on the basis of concentration and molecular weight. Ten-fold dilutions of transcribed RNA, containing 102-108 copies were used as standard in all real-time quantitative (qRT) -PCRs. A One Step SYBR PrimeScript PLUS RT-PCR Kit (TaKaRa, Shiga, Japan) was used in the determination of the RNA concentration of DENV-2 by qRT-PCR, with the forward primer 5'-ACAGTCTGGAACAGGGTGTGGATT-3', and the reverse primer 5'-TTGTTAGCCCAATCAAT GAGCCGC-3'; using a Bio-Rad iQ5, the following thermocycling conditions were employed: 95℃ for 10 s; then 40 cycles at 95℃ for 5 s, 60℃ for 30 s and 95℃ for 1 min; followed by 95℃ for 1 min and finally 81 cycles at 55℃ for 30 s.
-
The transfe cted cells were suspended in 25 mL DMEM with 10% (w/v) FBS. The cell s uspension (1 mL) was seeded into 12-well plates and assayed for luciferase activity at specific time points p.t.; tripl icate wells were seeded for each time point. At the indicated times, cells were washed with cold PBS and lysed with 200 μL lysis b uffer for 15 min at 37℃. Lysates (20 μL) were mixed with 100 μL assay reagent in a 96-well plate, and the luciferase signals were measured with a Modulus microplate multimode reader (Turner Biosystems, Sunnyvale, CA, USA).
-
BHK cell monolayers were transfected with 1 μg RNA, maintained in DMEM with 2% (w/v) FBS, and then harvested when CPE became obvious in the WTinfected BHK cells. At 48-h p.t., cells were harvested, washed, and incubated in 1×cell lysis buffer for western and immunoprecipitation (IP) (Beyotime, Haimen, China). The lysate was clarified by centrifugation at 12, 000×g for 10 min at 4℃ and then stored at -70℃. Samples prepared as above were diluted in non-reducing sample buffer (62.5 mmol/L Tris/HCl [pH 6.8], 10% [v/ v] glycerol, 0.05% [w/v] bromophenol blue) at 37℃, or incubated with 1×sample buffer containing a reducing reagent (1% [v/v] 2-mercaptoethanol) at 100℃ for 4 min, and were then subjected to electrophoretic separation, carried out using 10% (w/v) sodium dodecyl sulfate (SDS) polyacrylamide gels. Separated proteins were transferred to polyvinylidene fluoride (PVDF) membranes (Millipore), which were then blocked by treatment with 5% (w/v) non-fat milk in Tris-buffered saline with Tween (TBST) for 1 h at room tem perature. An anti-NS1 mouse polyclonal antibody (generously provided by Dr. Jia Fan)was used as the primary antibody (1:1000 dilution). After three 10-min washes with TBST, the blots were incubated with secondary anti-mouse IgG conjugated to horseradish peroxidase (1:5000, Millipore) at 37℃ for 1 h. Blots were analyzed using an Imaging Densitometer (Bio-Rad, CA, USA).
Cells and viruses
Plasmid construction
RNA transcription and transfection
Indirect Immunofluorescence assay (IFA)
Plaque assay
RNA extraction and Real-time RT-PCR
Luciferase assay
Analysis of NS1 proteins
-
Figure 1 shows the structure of the recombinant DENV-2 infectious clone and the amino acid sequence of DENV-2 NS1. A series of mutants of NS1 (three Cys sites [C4A, C55A, C291A], two N-linked glycosylation sites [N130A, N207A], a glutamic acid site [E173A], and a C-terminal truncated fragment [ΔC]), were constructed and incorporated into the infectious DNEV-2 clone. Mutant RNAs were synthesized in vitro and transfected into BHK-21 cells. Mutants N130A and E173A showed no significant diff erences compared to DENV-2 TSV01 (WT) viruses, but C4A, C55A, C291A, and ΔC each failed to cause CPE in transfected cells and did not generate any visible plaques (Figure 2A). In particular, the N207A mutation, which was altered at the second NS1 glycosylation site, produced fewer infectious viral particles and resulted in smaller plaques. Two possibilities might be a dvanced to account for the phenotype of no plaque generation: the first is that C4A, C55A, C291A, and ΔC mutant RNA could not generate any viral particles; the secondis that although mutant RNAs were able to generate infectious particles that could not form plaques. To further investigate the pr oduction of infectious viral particles following transfection, supernatant solutions harvested from transfected cells were used for the infection of BHK-21 cells, which was then followed by immunofluorescent assay (IFA) analysis using an anti-E mAb at 24-h post infection. Consistently, no positive IFA response could be detected for C4A, C55A, C291A, or the ΔC mutant (Figure 2B), demonstrating that all of these mutations impair the production of infectious viral particles. In addition, N130A, N207A, and E173A mutants each showed an approximately 5-20-fold reduction in terms of the specific infectivity compared to WT RNA (Table 1).
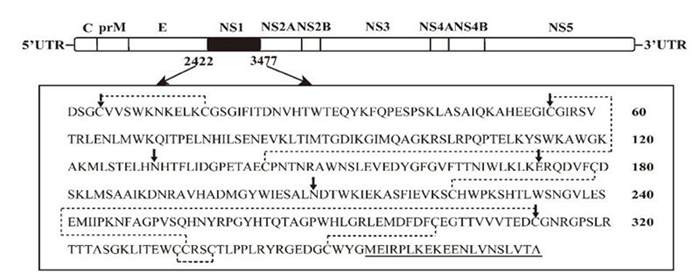
Figure 1. Schematic diagram of DENV2-TSV01 and the amino acid sequence (aa807-1159) of the NS1 protein. Systematic site-directed mutagenesis of the N-glycosylation sites and Cys sites is shown by arrows. The C-terminal region of the DENV-2 NS1 protein (aa333-352) that was deleted to generate the C-terminal truncated mutation (ΔC) is underlined. Dotted lines denote the formation of disulfide bonds between Cys residues.

Figure 2. A: Plaque morphology of mutant and WT viruses in BHK-21 cells; B: IFA of Vero cells 24 h after infection with mutant and WT viruses. Red indicates E protein in infected Vero cells (N130A, E173A, N207A and WT). The IFA scale bar represents 20 μm. Other mutants (C4A, C55A, C291A and ΔC) generated no visible fluorescence.
RNA titera CPE N130A 2.80 × 10⁷ + N207A 1.20 × 10⁷ + E173A 5.45 × 10⁷ + C4A < 102 (undetectable) - C55A < 102 (undetectable) - C291A < 102 (undetectable) - ΔC < 102 (undetectable) - WT 2.60 × 10⁸ + Table 1. Determination of wild type and all mutants titer
For mutants N130A, E173A, and N207A, we also analyzed growth kinetics on Vero cells. As shown in Figure 3, no significant differences between the mutant and WT viruses were observed in terms of viral titer at 24-, 48-, or 72-h p.t. Only at 96-and 120-h p.t. did the mutant viruses show slightly slower growth than WT viruses. Similar results were observed in qRT-PCR analyses of the supernatant solutions harvested from cells infected with mutants N130A, E173A, N207A, and with the WT (data not shown).
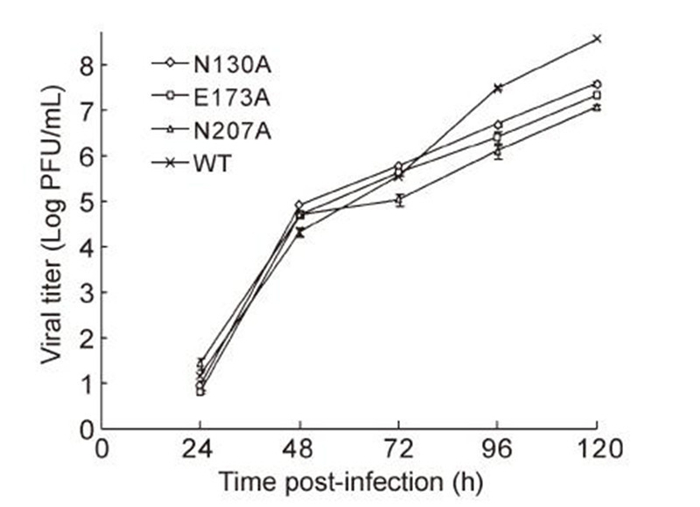
Figure 3. Comparison of viral growth kinetics on Vero cells. Cells were infected in 12-well plates with mutant and WT viral stocks (MOI of 0.1). Following sample collection (100 μL; 24, 48, 72, 96, and 120 h), virus titers were determined by plaque assays in BHK-21 cells.
For mutants C4A, C55A, C291A, and ΔC, we attempted to select for any revertants by blind passaging of the supernatant solution from transfected cells. However, even in the supernatant solution from the first passage, the intracellular viral RNAs were below the limit of detection. The RNA copies that were detect able in the P0 supernatant solution may have been residual input RNAs (Table 2). Collectively, these results demonstrated that the C4, C55, C291, and C-terminal residues of NS1 are essential for viral replication.
Mutants P0 (supernatant) P1 (supernatant) RNA Copies Ct RNA Copies Ct C4A 5.84×10³ 27.10 < 103
(undetectable)31.54 C55A 9.09×10³ 26.42 < 103
(undetectable)31.20 C291A 2.61×10⁴ 24.78 < 103
(undetectable)31.83 ΔC 2.04×10⁵ 21.64 < 103
(undetectable)30.55 Negative control < 103
(undetectable)34.24 < 103
(undetectable)35.12 Table 2. RNA copy analysis for the mutants
-
To further determine whether the defect in viral replication was due to the abolition of RNA synthesis, a luciferase-reporting replicon of DENV-2 (RlucRep) TSV01 strain was used to quantify viral translation and RNA synthesis with respect to the NS1 mutants. All the replicons generated a similar level of luciferase activity at 2-6 h p.t. (Figure 4), indicating that none of the mutations affected the translation of the input replicon RNA and that they all possessed similar transfection efficiencies. N130A and E173A revealed typical two-peak luciferase patterns while N207A replicated a bit slowly when compared with WT, replication of other mutants were declined significantly in cells. Taken together, this was consistent with the results obtained using the genome-length RNAs. These results indicated that the Cys sites at C4, C55, and C291 and the C-terminal residues of NS1 are required for viral RNA synthesis.
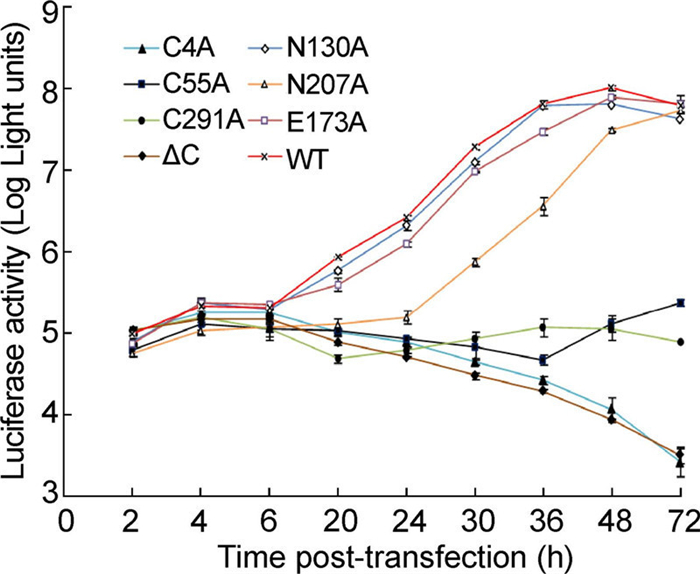
Figure 4. Analysis of the mutant and WT replicons based on DENV2-TSV01-Rep. Equal amounts of viral replicon RNA were electroporated into BHK-21 cells. At the indicated time points, the luciferase signals were measured. Each data point represents the average of three replicates. Error bars show standard deviations.
-
The results showed that, as in the case of WT RNA, mutations N130A, E173A, and N207A each gave rise to an NS1 band corresponding to about 90 kDa, representing the dimeric form of NS1. In contrast, no NS1 expression could be observed in cells transfected with C4A, C55A, C291A, or ΔC mutants, on account of viral replication disruption. In the case of the N130A and N207A mutant viruses, it was notable that the NS1 dimer migrated slightly faster during electrophoresis than the NS1 dimer of either the WT or E173A viruses, most likely due to deglycosylation at the corresponding positions (Figure 5). Although the level of NS1 expression in N207A was less than in N130A, E173A, or WT viruses, it is clear that glycosylation at positions 130 and 207 is not essential for viral replication.
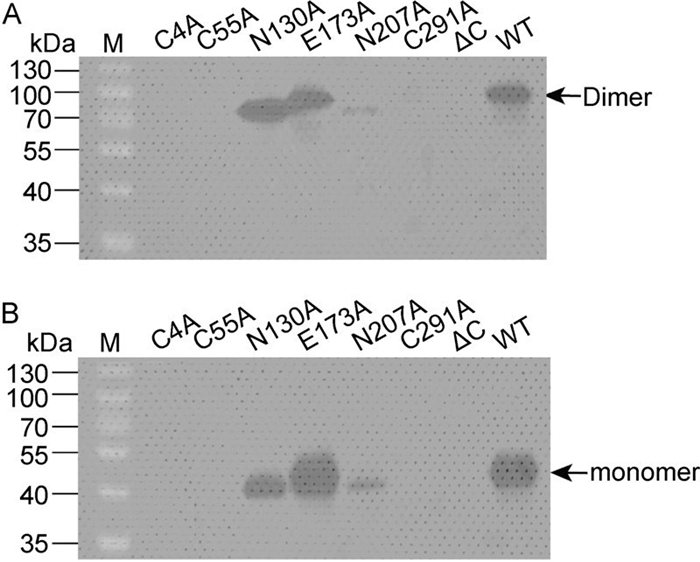
Figure 5. Western blot analysis of NS1 in transfected cells. Cells transfected with each viral genome-length RNA were lysed, and the intracellular NS1 proteins were probed with an anti-NS1 antibody. The samples were treated with 1×sample buffer without reducing reagents at 37℃ (A), or incubated with 1×sample buffer containing reducing reagent (2-mercaptoethanol) at 100℃ for 4 min (B) before electrophoresis. The dimeric and monomeric forms of NS1 are shown.
Production and characterization of NS1 mutant viruses
Effect of NS1 mutation on DENV RNA synthesis in BHK-21 cells
Analysis of NS1 in mutant viruses
-
Although the critical role of Flavivirus NS1 has been evaluated by several groups, little is known about the mechanism of its participation in viral replication. Previous studies have shown that a lack of NS1 glycosylation could impact the secretion of NS1 from infected cells and reduce the growth of infectious viruses. It is reported that Asn130 of DENV-1 NS1 is important for viral replication in both mammalian and mosquito cells. Crabtree et al. reported that the altered Asn-130 of the DENV-2 NS1 resulted in reduced growth in C6/36 cells but it exhibited similar growth characteristics compared to those of the parent virus in LLC-MK2 cells (Crabtree M, 2005; Tajima S, 2008). Muylaert et al. presented the ablation of Asn-130 sites as resulting in small plaque phenotypes, decreased virus yields, reduced CPE, impaired NS1 secretion, depressed RNA accumulation and attenuated mouse neurovirulence (Muylaert I, 1996). Pryor and Wright and Somnuke et al. found that NS1 lacking Asn-207 showed reduced dimer stability and secretion in DENV-2 (Pryor M, 1994; Somnuke P, 2011). Other reports revealed that the loss of Asn-207 resulted in increased mouse neurovirulence in a TBE/DENV-4 chimera, though not in the case of yellow fever virus (YFV) (Pletnev A, 1993). Moreover, Pryor and Wright found that the substitution of Ala for several Cys residues that are located within the C-terminal region of NS1 prevented dimer formation (Pryor M, 1993). Antibodies induced by NS1 lacking the C-terminal region showed lower platelet binding ability (Chen M, 2009). Collectively, these results indicate the possible role of NS1 in viral replication and pathogenesis, although they appear to be somewhat inconsistent.
In our study, we successfully introduced several mutations into NS1, in both a DENV-2 replicon and a full-length infectious clone, including two N-terminal glycosylation sites (N130 and N207), three Cys residues (C4, C55, and C291), a hydrophobic glutamic acid residue site (E173), and a 20-amino-acid peptide deletion in the C-terminal. The results s uggested that ablation of the glycosylation at N207 but not at N130 of DENV-2 NS1 slightly weakened viral replication in BHK-21 and Vero cells. The results were similar to previous results in a TBEV/DENV-4 chimera but were not consistent with observations in YFV and DENV-1. Moreover, mutants at the three C ys sites (C4, C55, and C291) or carrying the C-terminal deletion could not produce visible CPE or viral growth when transfected into mammalian BHK-21 cells. These findings demonstrated that whereas deglycosylation of N S1 did not dramatically reduce viral replication, Cys residues were required for DENV-2 replication. Because Pryor and Wright demonstrated that the substitution of an Ala for any one of the last three Cys residues in the C-terminal region of the protein is important in dimer formation, our results indicate that both t he N-and C-terminal Cys residues of NS1 are essential for DENV-2 replication. On account of the impairment of viral replication caused by the Cys-to-Ala mutations, we could not detect NS1 in other mutants without CPE; the proteins could only be identified in cells in which CPE was apparent Therefore, we could not conclude whether these Cys mutations affected NS1 secretion or dimerization in cells transfected with mutant RNAs. The structure of NS1 (Akey D, 2014) illustrates the importance of the ordered linkage of the disulfide bonds. We can deduce that the mutation of Cys in our system would ablate the formation of correct disulfide bonds within NS1, thereby significantly altering the folding of NS1 and disrupting the protein's function. Furthermore, the eight amino acids at the C-terminal of NS1 are essential for correct processing at the NS1-NS2A junction, which is functionally recognized by host cell signalase for cotranslational cleavage. (Hori H, 1990). Our results concerning the C-terminal truncation of NS1 provide genetic information that supports these biochemical findings.
Finally, our data are consistent with a previous report that flavivirus NS1 is involved in the early stage of viral replication (Lindenbach B, 1997). Nevertheless, the details of the mechanism of action of NS1 remain to be fully elucidated.
-
We thank Dr. Pei-Yong Shi for providing the plasmid pACYC-DENV2-TSV-f1 vector and recombinant Renilla luciferase-reporting replicons (Rluc-Rep) of DENV2-TSV01 used in our study. This work was supported by Important National Science & Technology Specific Projects (2012ZX10004219, 2012ZX10004403), the National Natural Scientific Fund of China (81072675), and the Wuhan Key Laboratory on Emerging Infectious Diseases and Biosafety.
-
All the authors declare that they have no competing interest. This article does not contain any studies with human or animal subjects performed by any of the authors.
-
ZY designed the experiments. JF carried out the experiments. ZY, JF, and YL analyzed the data. JF and ZY wrote the paper. All authors read and approved the final manuscript.


 DownLoad: