


HTML
-
The human immunodeficiency virus (HIV) type 1 (HIV-1) envelope (Env) protein consists of a trimer of heterodimers of the gp120 surface protein and the gp41 trans-membrane protein (Dalgleish et al., 1984; Klasse, 2012; Cardaci et al., 2013). HIV-1 gp120 is responsible for binding both the CD4 receptor and coreceptors (CCR5 or CXCR4) on the target cell, whereas gp41, together with gp120, mediates fusion of the viral and host cell membranes for virus entry (Alkhatib et al., 1996; Deng et al., 1996; Feng et al., 1996). The gp120 monomer has five highly conserved regions (C1-C5) and five variable regions (V1-V5) (Starcich et al., 1986; Willey et al., 1986). Due to the error-prone nature of HIV reverse transcriptase and extensive selection pressure from the host immune system, the HIV genome has undergone many mutations, particularly in the variable loop regions of the env gene, to escape immune recognition. Thus, after disease progression, viral diversity inside the host is extremely high. However, transmission of HIV involves a population bottleneck, in which a limited number of variants from a genetically diverse viral quasi species in the transmitting partner establishes productive infection in the newly infected partner (Salazar-Gonzalez et al., 2009; Shaw and Hunter, 2012; Joseph and Swanstrom, 2014). Many researchers have attempted to elucidate the specific genetic characteristics of these transmitted viruses that are preferentially selected during each transmission event (Keele et al., 2008; Sagar et al., 2009; Boeras et al., 2011; Wilen et al., 2011; Frange et al., 2013; Parrish et al., 2013; Del Prete et al., 2014; Gonzalez et al., 2015); such information is expected to provide important insights into vaccine development.
During the course of HIV infection, the V1V2 region exhibits the most diversity, with many substitutions, deletions, and insertions, and the statistically longer V1V2 region of chronically infected viruses is believed to be the result of escape from the immune response (Sagar et al., 2006; Curlin et al., 2010; Liao et al., 2013a; Nie et al., 2014). In addition, these longer V1V2 viruses are more resistant to specific neutralizing antibodies, and the adaptation of V1V2 is also found at the population level during HIV epidemics, with contemporary viruses having modestly longer V1V2 regions and more glycosylated sites than historical viruses (Bunnik et al., 2010; van Gils et al., 2011). Recent studies indicate that this genetic signature may have conferred increased neutralization resistance to Env over the course of the HIV epidemic (van Gils et al., 2011). However, although not exclusive, current data suggest that newly transmitted viruses encode shorter and less glycosylated variable loop regions, particularly for the V1V2 region, compared with that encoding Env acquired from chronically infected partners (Chohan et al., 2005; Liao et al., 2013b). Additionally, some studies have indicated that these genetic signatures exhibit enhanced fusion and virion incorporation capacity, which can be advantageous during transmission (Cavrois et al., 2014). Moreover, in addition to its potential role in transmission and immune escape, V1V2 also influences virus entry and is a new target for broadly neutralizing antibodies (bNabs) (O'Connell et al., 2014).
Both HIV and its precursor SIVcpz originated from cross-species transmission events, and many studies have investigated the transmission origin of these viruses (Worobey et al., 2010; Sharp and Hahn, 2011; Sharp et al., 2013). Unlike HIV, ancient SIVs have undergone adaptive evolution over thousands of years. Thus, analysis of the changes in gp120 genotypes during the transmission history between SIVs and HIV may provide insights into the V1V2 signature during transmission and subsequent adaptation. Subsequent functional studies may improve our understanding of the role of the V1V2 signature in HIV infection and transmission.
Accordingly, in this study, we analyzed gp120 genotypes from SIV and HIV sequences and confirmed that the V1V2 region, particularly the V1 region, may play an important role in HIV transmission or function. Next, based on the sequence characteristics, we constructed various Env mutants from different HIV-1 subtypes in order to elucidate the role of the V1 region in Env function.
-
293T and TZM-bl cells were cultured in Dulbecco's modified Eagle's medium (DMEM; Gibco, Grand Island, USA) supplemented with 1% glutamine and 10% fetal bovine serum (Gibco). The 293CD4R5X4 dual tropism cell lines were established by transfection with a CCR5-expressing plasmid (Vigene, Rockville, USA), selected with puromycin, and maintained in DMEM containing 0.7 μg/mL puromycin. All other conditions were as described above. All cell cultures were grown at 37℃ in an atmosphere containing 5% CO2. Dual split protein (DSP) assays were used to determine the fusion capacity of the HIV-1 isolates. Stable cell lines expressing DSP1-7 and DSP8-11 were a kind gift from Prof. Matsuda of the Institute of Biophysics, CAS (Kondo et al., 2010; Ishikawa et al., 2012; Wang et al., 2014).
Construction of ∆V1 deletion mutants (∆V1) for different HIV-1 subtypes was carried out as follows. Wild-type env genes of five HIV-1 subtypes cloned from blood samples of patients with HIV were inserted into pcDNA 3.1D/V5-His-TOPO (Invitrogen, Carlsbad, USA) as a template for mutagenesis, and different V1 mutants were constructed using corresponding primers (Table 1). The subtype B V1 loop was also replaced by Gly-Gly-Gly-Gly-Ser (GGGGS) linkers of different lengths to generate different V1 loop replaced mutants. All mutants were confirmed by sequencing of the entire env gene.
Primers Sequences (5′-3′) Primers Sequences (5′-3′) B∆V1-F AAGGGCGAGATCAAGAACTGCAGCT B'∆V1-F GATATGAAAAACTGCTCTTTCAATCTC B∆V1-R GCACTTCAGGCTCACGCACAGGGG B'∆V1-R AGTGCAATTTAAAGTAACACAGAGTGG B1GS-F CGGCAGCAAGGGCGAGATCAAGAACTGCAGCT 01_AE∆V1-F GAAGTAAGAAACTGTTCTTTTAATGTG B1GS-R CCGCCACCGCACTTCAGGCTCACGCACAGGGG 01_AE∆V1-R GGAACAATTTAAAGTAACACAGAGAGG B2GS-F GGCGGTGGCGGCTCTAAGGGCGAGATCAAGAACTGCAGCT 07_BC∆V1-F GAAATGAAAAATTGCTCTTTCAATACA B2GS-R GCTGCCGCCGCCACCGCACTTCAGGCTCACGCACAGGGG 07_BC∆V1-R ACATTCTAAAGTGACACAGAGTGGGGT B3GS-F GGCGGTGGCGGCTCTCGGCAGCAAGGGCGAGATCAAGAAC 08_BC∆V1-F GGAGTAAAAAATTGCTCTTTCAATGCA B3GS-R GCTGCCGCCGCCACCCCGCCACCGCACTTCAGGCTCACGC 08_BC∆V1-R ACAGTTTAAAGTGACACAGAGTGGGGT B4GS-F GGCGGTGGCGGCTCTGGCGGTGGCGGCTCTAAGGGCGAGA -- -- B4GS-R GCTGCCGCCGCCACCGCTGCCGCCGCCACCGCACTTCAGG -- -- B5GS-F GCGGCAGCGGTGGCGGCGGCAGCGGCGGTGGCGGCTCTGGCGGT -- -- B5GS-R CGCCACCGCACTTCAGGCTCACGCACAGGGGGGTCAGCTTCACG -- -- B6GS-F GGCGGTGGCGGCTCTCGGCAGCAAGGGCGAGATCAAGAAC -- -- B6GS-R GCTGCCGCCGCCACCCCGCCACCGCACTTCAGGCTCACGC -- -- B7GS-F GGCGGTGGCGGCTCTGGCGGTGGCGGCTCTAAGGGCGAGA -- -- B7GS-R GCTGCCGCCGCCACCGCTGCCGCCGCCACCGCACTTCAGG -- -- Table 1. Sequences of primers used in this study
All the primers used in this study are listed in Table 1.
-
HIV-1 stocks encoding the luciferase reporter gene were produced by transfecting the HIV-1 proviral constructs pNL4-3.LucE and pcDNA 3.1 (containing Env) into 293T cells using Lipo2000 reagents (Life Tech., Grand Island, USA). One day after transfection, the cell medium was refreshed, and cells were incubated for another 24 h. The supernatants were then harvested and centrifuged to remove cell debris, followed by passing through a 0.45-μm filter and quantification using an HIV-1 p24 enzyme-linked immunosorbent assay (ELISA; Advanced BioScience Laboratories, Rockville, USA). 293CD4R5X4 cell lines plated 1 day earlier were infected with normalized virions at specific concentrations (1 ng p24/104 cells). DEAE-dextran was added to each infection well at a final concentration of 15 μg/mL. The cells were harvested 24 or 48 h later, washed twice with 1× phosphate-buffered saline (PBS; Gibco), and then used in luciferase reporter assays. Relative infectivity was calculated by dividing the Log10 (RLU of the mutant virus) by the Log10 (RLU of the wild-type virus).
-
Proteins isolated from cells and HIV virions were obtained from different experiments.
For Env expression assays, 293T cells ( > 90% confluence in 6-well culture plates; Corning, USA) were transfected with 2 μg of each Env expression plasmid, incubated at 37℃ for 24 h, washed with PBS, and centrifuged at 800× g for 5 min. Harvested cells were lysed using RIPA lysis buffer, and the lysates were then subjected to sodium dodecyl sulfate polyacrylamide gel electrophoresis (SDS-PAGE). Gp160 and gp120 were detected using sheep anti-gp120 antibodies (Aalto Bio, Iceland). Other antibodies used for western blotting were as follows: anti-GAPDH monoclonal antibodies (MAbs; Beyotime, Guangzhou, China), horseradish peroxidase (HRP)-linked anti-mouse/rabbit secondary antibodies (Cell Signaling Technology, Danvers, USA), and anti-HIV-1 p24 MAbs (Santa Cruz Biotechnology, Santa Cruz, USA).
For Env incorporation into virions, virus (equivalent to 100 ng p24) was precipitated using 5× PEG-it virus precipitation solution (SBI, Shanghai, China), lysed using P0013, and boiled in a defined amount of sample buffer (containing 1/19 volume of β-ME; Bio-Rad, Hercules, USA). The prepared protein samples were used for western blotting, as described above.
-
The infectivity of each pseudovirus containing different Env mutants was determined using luciferase reporter assays. Briefly, cells infected with HIV-1 reporter pseudo-viruses were harvested, washed twice with 1× PBS, and then assayed using the Luciferase Assay System (Promega, Madison, USA) following the manufacturer's instructions. Relative infectivity was then calculated by dividing the Log10 (RLU of the mutant virus) by the Log10 (RLU of the wild-type virus).
-
For fusion assays, cell lines stably expressing DSP were utilized. Stable cell lines expressing DSP8-11 were transfected with expression vectors of interest for Env constructs in triplets. At 48 h post-transfection, 293CD4/DSP1-7 cells, a stable cell line expressing the CD4 molecule and DSP1-7, were cocultured with transfected 293FT/DSP8-11 cells at 37℃ in fresh medium. After about 4-6 h of incubation, membrane fusion was analyzed using fluorescence microscopy (Ishikawa et al., 2012).
The 293CD4X4R5 cell line was also used to assay membrane fusion. Briefly, 293CD4X4R5 cells in 12-or 24-well plates were transfected with different Env expression plasmids. After 24 h of incubation at 37℃, membrane fusion was directly visualized by microscopy.
-
All SIV and HIV env sequences used in this study were downloaded from the LANL HIV sequence database. For comparison of env in the SIV and HIV-1/2 transmission history, env sequences were grouped into four datasets (SIVs, SIVgsn/mon/mus, SIVcpz, and HIV-1) for SIV/HIV-1 and three datasets (SIVsmm, SIVmac, and HIV-2) for SIV/HIV-2, according to known transmission history. Unlike HIV, SIVs have only been shown to have a few variations in sequences; therefore, we used as many sequences as possible based on the HIV Sequence Compendium 2014. Additionally, for HIV-1 and HIV-2 (Figure 1), because many different HIV sequences have been identified to date, we only chose representative standard sequences for each group and subtype according to the HIV Sequence Compendium 2014. For comparison of HIV-1 env sequences between different epidemic periods (Figure 2), we attempted to compare changes in the lengths of the V1V2 region during a 15-20-year evolution period. Thus, each sequence was selected based on its sampling date. Sequences having 15-20 years of sampling (defined here as historical and contemporary sequences) were chosen. Only one sequence for each patient was included, and we adjusted the sampling dates of the historicaland contemporary sequences to ensure that there were sufficient numbers of sequences for each comparison. More information regarding the sequences used in this study is given in Supplementary Tables S1-S3.
Figure 1. Sequence changes in gp120 protein during the SIV and HIV-1/2 transmission history. Amino acid numbers in each region of the gp120 protein were calculated using online tools for SIV/HIV-1 (A) and SIV/HIV-2 (B). Student's t-tests were performed to determine the significance of differences between the two groups; *, P < 0.05; **, P < 0.01.
Figure 2. Changes in the sequence of the V1V2 region after 15-20 years of evolution for different HIV-1 subtypes. Amino acid numbers in the V1 and V2 regions were calculated for subtypes B, C, G, group O, CRF01_AE, and 02_AG, for which there were sufficient numbers of sequences with sampling date spaced apart by 15-20 years. Student's t-tests were performed to determine the significance of differences between the two groups; *, P < 0.05; **, P < 0.01. #His: historical sequences; Con: contemporary sequences.
Variable loop characteristics were determined using the online tools (http://hivtools.publichealth.uga.edu/N-Glyco and http://www.hiv.lanl.gov/content/sequence/VAR_REG_CHAR).
-
Statistical analysis was carried out using GraphPad Prism v6 (La Jolla, CA 92037 USA). The data from the luciferase reporter assays are presented as the means ± standard deviations (SDs) of three independent experiments. For comparisons of two datasets, Student's t-tests were performed, and differences with P values of less than 0.05 were considered significant.
Cells, plasmids, and primers
Virus production and infection
Western blot analysis
Infectivity assay
Membrane fusion assay
Sequence analysis
Statistical analysis
-
Existing SIV sequences, which are ancestors of HIV, may serve as "fossils" for analysis of env gene evolution during SIV/HIV transmission history. In this study, we collected two groups of SIV and HIV sequences, which showed clear transmission events, and we analyzed changes in gp120 sequence characteristics during each transmission history. When we focused on the SIV gp120 proteins, major differences were observed as compared with that of HIV-1 (Figure 1A). Generally, most SIVs encoded much longer gp120 protein (507.5 amino acids [aa]) than that encoded by HIV-1 (475.4 aa). However, SIVcpz, the precursor of HIV-1, encoded a gp120 protein having almost the same length (481.1 aa) as that of HIV-1. Interestingly, the longer gp120 in most SIVs could be explained by the increased length of the V1 region (51.5 aa). Even SIVcpz, which had almost the same length as gp120, encoded a much longer V1 region (32.2 aa) than HIV-1 (25.3 aa). Furthermore, SIVcpz was the result of recombination between SIVrcm and an unknown SIV from the SIVgsn/mon/mus lineage, which could account for the Env region of SIVcpz. We found that the V1 segment of viruses from this lineage was shorter (40.6 aa) than that of other ancient SIVs (51.5 aa) but longer than that of SIVcpz (32.2 aa). Additionally, we observed the same phenomenon in SIV/HIV-2 transmission history (Figure 1B). SIVsmm, which was the ancestor of SIVmac and HIV-2, had a much longer V1 region (59.4, 56.1, and 48.6 aa for SIVsmm, SIVmac, and HIV-2 respectively). This phenomenon, together with the observed preferential selection for the shorter V1 region during current HIV-1 transmission, indicated that the V1 region may play an essential role in transmission and selection preferences (Dang et al., 2014).
-
Although the transmission bottleneck selects for viruses with compact loops and fewer N-glycosylation sites, the HIV-1 subtype B has been reported to escape from immune recognition by ongoing insertions in the V1V2 loop, yielding a longer V1V2 loop after 10-20 years of evolution. Therefore, we analyzed many available sequences from six subtypes and circulating recombinant forms (CRFs) that had a 15-20-year time span (Figure 2). A slight increase (0.5-3.0 amino acids for different subtypes) in V1 length was observed for all subtypes, with significance observed for subtypes B and C owing to the relatively high numbers of available sequences for these subtypes. In contrast, no clear increase was observed for the V2 region. Consistent with previous results, these data indicated that there was ongoing genetic drift in the V1 region to acquire more amino acids, which was believed to mediate escape from neutralizing antibody (Nab) recognition (Bunnik et al., 2010; van Gils et al., 2011).
-
Next, by comparing sequence changes during SIV/HIV transmission, we found that the V1 region may play an important role in transmission selection, particularly for the length of the V1 region. In order to determine whether the length of the V1 region affected Env function, we used Env of HXB2 as backbone and established a series of mutations in which the V1 region was deleted and replaced with different lengths of amino acids (1× GGGGS to 7× GGGGS). First, we used a membrane fusion assay system to detect the functions of wild-type and mutant Env. The results showed that none of the Env constructs (V1 deleted or replaced with different linkers) could initiate target cell membrane fusion (Figure 3A). Then, we produced pseudoviruses containing these different Env constructs and performed infectivity assays. Similar to the above findings, compared with the wild-type virus, all pseudoviruses lost infectivity (Figure 3B). These results indicated that the V1 region was indispensable for Env function. Although there did not appear to be any conservative sequences in this highly variable region, simply replacing the disorganized amino acids could impair Env function.
Figure 3. The V1 loop was essential for Env function. The effects of different lengths of V1 amino acids on membrane fusion capacity (A) and virus infectivity (B) were analyzed. For infectivity assays, all mutants were normalized to the wild-type Env infectivity (100%). Western blot analysis of gp160 and gp120 expression in 293T cells and incorporation into the virus for wild-type viruses and different mutant viruses are shown in (C) and (D), respectively. Scale bars (red line) represent 100 μm.
-
To determine whether different mutations affected Env expression and incorporation, which could influence virus infectivity, we analyzed the gp120 expression and incorporation capacity of subtype B (HXB2) by western blotting (Figure 3C, 3D). The results showed that most V1 mutants expressed similar levels of precursor gp160, whereas ∆V1 and 1G4S expressed lower levels of gp160. However, compared with the wild-type virus, the level of gp120 (relative to total gp160 expression, i.e., gp120 / gp120 + gp160) in the mutant Env-expressing cells (Figure 3C) and pseudoviruses (Figure 3D) was dramatically reduced, suggesting that V1 deletion or replacement impaired the processing of gp160. Gp160 processing into mature gp120 and gp41 is a prerequisite for normal Env function; thus, loss of function of these mutants may be due to impairment of gp160 processing capacity by the changes in the V1 sequence. These results suggested that specific V1 sequences may be critical for gp160 processing in HXB2.
-
In order to determine whether the observed role of the V1 region was independent of the specific clone or subtype, we amplified the env gene from four different subtypes and CRFs (B', 01_AE, 07_BC, and 08_BC) isolated from patient blood samples. These genes were then cloned into the pcDNA 3.1-TOPO plasmid, and corresponding V1-deleted Env clones were constructed. Using these clones, we first examined membrane fusion capacity in 293CD4R5X4 cells. The results showed that compared with the wild-type construct, all V1-deleted Env proteins for each subtype exhibited loss of fusion capacity (Figure 4A). Next, we performed infectivity assays for pseudoviruses for each subtype (Figure 4B). The results also showed that the V1 loop was indi-spensable for virus infection. Next, we analyzed the expression and incorporation of Env (Figure 4C). Interestingly, we also observed similar results in that, relative to the wild-type Env, all V1-deleted Env mutants exhibited greatly reduced gp160 processing capacity in cell lysates, although some mutants had weak Env expression relative to that of the wild-type virus (Figure 4C, upper panel). Consistent with this, all mutant viruses exhibited reduced or lack of incorporated gp120 (Figure 4C, lower panel), suggesting that Env incorporation was impaired in these V1 mutants. However, these results may also be explained by weak Env expression and maturation.
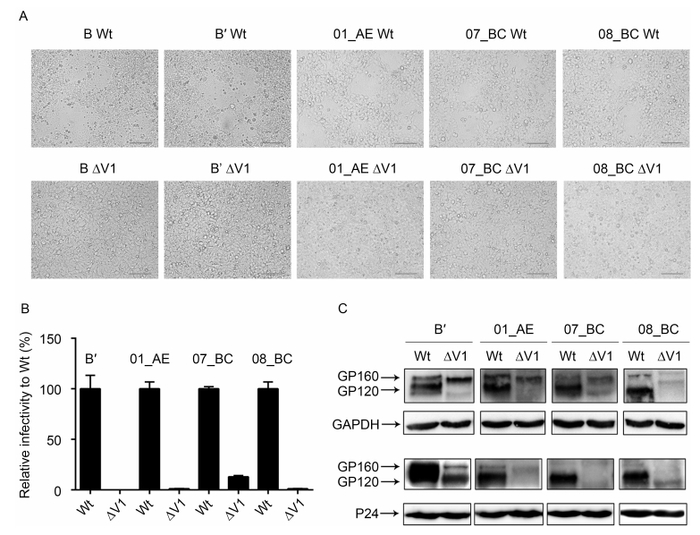
Figure 4. Confirmation of V1 loop function in four subtypes of HIV-1. Wild-type and V1-deleted Env proteins of subtypes B', 01_AE, 07_BC, and 08_BC were analyzed to determine fusion capacity in 293TCD4R5X4 cell lines. Membrane fusion was visualized at 24 h after transfection (A). Relative infectivity of viruses harboring different V1-deleted Env proteins normalized to that of the wild-type virus (100%) was determined by luciferase reporter assay (B). Western blot analysis of gp160 and gp120 expression in 293T cells and incorporation into the virus for wild-type and V1-deleted Env (C). Scale bars (red line) represent 50 μm.
Taken together, our findings confirmed that the V1 loop was indispensable for Env function, possibly due to impaired Env processing and incorporation. Importantly, this function was observed in different HIV-1 subtypes.
The shorter V1 region was preferentially selected during SIV and HIV-1/2 transmission history
The V1 loop length increased slightly over a period of 15-20 years
The function of the V1 region could not be replaced by amino acid linkers of different lengths
V1 mutants may influence normal Env function by impairing gp160 processing
The V1 loop may be necessary for Env function in different HIV-1 subtypes
-
The transmission bottleneck plays an important role in HIV transmission and evolution, and identification of the preferentially selected phenotype will improve our understanding of HIV evolution and facilitate the development of vaccines or drugs that target specific viruses. Many studies have shown that the V1V2 loop of gp120 is a key region in NAb recognition and may act as a selective target in transmission and evolution, particularly because of the length and N-glycan modifications of this region (Chohan et al., 2005; Sagar et al., 2006; Samleerat et al., 2008; van Gils et al., 2011). However, these studies have mainly focused on a few subtypes, and the results have not been consistent due to limitations in available datasets. Therefore, in this study, we first used SIV and HIV gp120 sequences that had a clear transmission history and used these sequences to analyze changes in the sequence length during this transmission and evolution flow. Our results provided important insights into the evolution and role of the V1 region of the HIV sequence and may facilitate the development of novel HIV vaccines.
In this study, we found that shorter V1V2 regions, particularly for V1, were selected during cross-species transmission. Moreover, this phenomenon was observed for both HIV-1 and HIV-2, indicating that selection bias of the V1 region may not be a coincidence. In fact, some studies have shown that natural SIV transmission in the wild is also associated with a genetic bottleneck similar to that observed for HIV transmission (Stone et al., 2010). According to current data, we speculate that the transmission bottleneck and subsequent adaptive evolution may account for the changes in V1V2 length observed in different cross-species transmission events. Some unknown SIVs gave rise to SIVgsn/mon/mus, and the sequences were then transmitted to SIVcpz and subsequently to HIV-1; in accordance with the selection bias, the observed V1V2 length decreased during this transmission history. Additionally, the extensive transmission of HIV-1 among human populations has shown a similar selection bias. Notably, in addition to the V1 region, the V4 region in HIV-1/SIV transmission history has also exhibited changes, as shown in Figure 1A, with selection of longer or shorter V4 regions. The V4 region in the HIV-2/SIV transmission history showed changes similar to those observed for V1 (i.e., a shorter V4 sequence was selected). Little is known about V4; however, V4 is thought to be critical for Env entry into specific HIV strains (Li et al., 2014), and recent studies using both sequences from the HIV database and transmission clusters have found a negative correlation between the V1V2 and V4V5 regions in terms of amino acid lengths during transmission. Notably, this correlation was lost following seroconversion (Pollakis et al., 2015), indicating that the relationship between these regions may be complex. Based on our current findings, V4 may also play an important role in transmission. However, additional studies are needed to support this hypothesis.
The relative long V1V2 region and additional glycosylation sites serve to protect the virus from the humoral immune response when the virus transmits to a new host. Because the naïve host lacks an HIV-specific immune response, these escape features are no longer necessary, and any fitness cost associated with them may hinder transmission. Although the transmission bottleneck selects viruses with compact loops and fewer N-glycosylation sites, after years of evolution, the virus has adapted to the humoral immune response by enhancing the mask of its envelope. As a result, since the zoonotic transmission from SIVcpz, HIV has been evolving to adapt to the human host, and one of the escape features that HIV has acquired is extension of the V1 region.
The population-wide evolution rate of HIV is low compared with the dramatic sequence changes that occur in each host (Curlin et al., 2010), and changes in the V1 loop at the population level were not obvious, as we showed in Figure 2. This could be due to selection bias, resulting in a step back in evolution to consensus (Carlson et al., 2014). Moreover, HIV has a relatively short evolutionary time compared with that of SIV. Most SIVs encode a much longer V1V2 region, and infection by SIVs in natural hosts is nonpathogenic, with the exception of SIVcpz, which shows symptoms similar to those of acquired immunodeficiency syndrome (AIDS) in the natural host. The genome of SIVcpz encodes a V1V2 region that is longer than that of HIV but shorter than that of other ancient SIVs. This may be the result of its relatively moderate evolutionary history compared with that of other SIVs and HIV. Moreover, because HIV does not have a relatively long history, we may expect that given a much deeper coevolution between HIV and its human hosts, HIV can evolve with a more adaptive genome, and one of the features of this adaptive genome could be an even longer V1V2 region than that observed in SIV today.
Based on our results, we next constructed different V1 mutants in order to elucidate the function of V1. Although V1 appeared to be comprised of disorganized, highly variable amino acids, this region may function in synergy with other parts of Env. Additionally, consistent with previous studies (Hamoudi et al., 2013; Yuan et al., 2013), replacing or changing the V1 region may also impair Env function, supporting the sophisticated evolutionary mechanism of the Env protein. Moreover, deletion of the V1 region indicated that this region was essential for membrane fusion and virus infection, and these findings were confirmed in all subtypes examined in this study. Furthermore, the V1 region may influence Env processing and incorporation, as was shown by western blot analysis. In all subtypes examined in this study, the V1 region may influence Env processing, thereby leading to impairment of Env function. In some subtypes (i.e., 07_BC, 08_BC, and 01_AE), in addition to impaired Env processing, we also observed reduced Env incorporation, which may be due to the impaired expression of Env, resulting in even lower packaging capacity. Unlike HXB2, the other subtypes used in this study were cloned from blood in our laboratory, and the expression capacity was not sufficiently high; this may affect the overall expression of Env and subsequent packaging of the virus. However, the V1 mutation in these subtypes may also directly influence Env incorporation, leading to failed infection, as observed in this study. Additional studies are needed in order to fully elucidate the mechanisms involved in these processes. Env protein is first synthesized as precursor gp160, which is cleaved into mature gp120 and gp41 by host enzymes (Wang et al., 2008). Mutations in the V1 region may alter the conformation of the cleavage sites, resulting in weak processing efficiency and low gp120 incorporation. Thus, the V1 region is indispensable for Env function and virus infectivity.
In summary, we found, for the first time, that the gp120 V1 region was preferentially selected during SIV/HIV transmission and evolution and was indispensable for HIV infection, suggesting that the V1 region may serve as an attractive target for designing new HIV prevention tools such as vaccines and drugs. However, like other studies, there are still a lot limitations of our study. For example, if it is possible we can use more sequences of all the subtypes, and divide them into more epidemic groups, this may give us a gradual change of V1 region following evolution; and in order to see the influence of V1 length on envelope function, instead of the linkers we used here, we can exchange the V1 region between different clones. Besides, env characteristic changes in real human transmission pairs may provide more useful evidence to our results. Further studies of the sensitivity of V1 mutants and glycan modifications in this region to sCD4 and different NAbs are needed in order to determine how V1 amino acids and glycans affect env function and escape from immune recognition.
-
This work was supported by the International Science & Technology Cooperation Program of China (2011DFA31030) and Deutsche Forschungsgemeinschaft (Transregio TRR60), National Natural Science Foundation of China (No. 81461130019), the Key Laboratory on Emerging Infectious Diseases and Biosafety in Wuhan and The Core Facility and Technical Support, Wuhan Institute of Virology. And we would like to thank Prof. Matsuda from Institute of Biophysics, CAS, for cell lines expressing DSP1-7 and DSP8-11.
-
The authors declare that they have no conflict of interest. This article does not contain any studies with human or animal subjects performed by any of the authors.
-
YPL, BLS and RGY conceived and designed the experiments; YPL and JPS performed the experiments; YPL and YW analyzed the data; YPL, BLS and Ulf Dittmer wrote and edited the paper. All authors have read and approved the final manuscript.
Supplementary tables are available on the website of Virologica Sinica: www.virosin.org; link.springer.com/ journal/12250.
-
SIV/HIV-1 SIV/HIV-2 HIV subtypes (group) Historical Contemporary SIVs (49) SIVsmm (33) B 52 180 SIVgsn/mon/mus (8) SIVmac (27) C 43 422 SIVcpz(28) HIV-2 (30) D 10 15 HIV-1 (62)* G 11 26 01_AE 50 143 02_AG 13 22 O 10 8 Note: *For HIV-1, we choose all the representative sequences from each subtype (group) for the analysis. Historical and contemporary sequences were sequences having 15-20-year sampling time intervals and excluded subtypes that did not have a sufficient number of sequences according to our criteria in the methods. Table S1. Env sequences used in this study
Table S2. Sequences used in the analysis of SIV/HIV-1 transmission history in Figure 1
Table S3. Historical and contemporary HIV-1 sequences used in analysis in Figure 2


 DownLoad: