


-
Dear Editor,
RNA virus features the high per-generation mutation rate, resulting in highly diversified population, which determines viral phenotypes and fitness (Domingo et al. 2012). The development of deep sequencing and bioinformatic techniques paves the way to study viral population genetics at an intrahost level, and has provided new insights into viral evolution. In a study conducted by Lakdawala et al. (2015), viral intrahost analysis was applied to monitor rapid selection of influenza virus with functional mutations. With a similar method on seasonal influenza virus, Debbink and colleagues have examined the viral intrahost heterogeneity and claimed that vaccine-induced immunity had minor impact on antigenic drift (Debbink et al. 2017). Particularly, in combating emerging outbreaks, the intrahost analyses have also been conducted to investigate the evolution of infectious disease pathogens, including the Ebola virus (EBOV) in West Africa (Ni et al. 2016), Zika virus (ZIKV) transmission in the Americas (Metsky et al. 2017), and imported yellow fever virus (YFV) in China (Chen et al. 2018).
Nowadays, two approaches have been applied to effectively enrich viral genomes from clinical samples, including (1) viral RNA capture following the depletion of host RNA (Matranga et al. 2014; Metsky et al. 2017) and (2) direct viral-specific genomic amplification (Ni et al. 2016; Metsky et al. 2017; Chen et al. 2018). The bioinformatics methods have also been developed accordingly (Yang et al. 2013; Ni et al. 2016). From the comparison of these two approaches, the viral-specific genomic amplification exhibited higher sequencing depth of viral genome, thus may identify more intrahost single nucleotide variations (iSNVs), even for some clinical samples with ultra-low viral content (Ct > 30) (Ni et al. 2016; Metsky et al. 2017). However, due to the lack of evaluation of the viral-specific genomic amplification, the bias of using iSNVs to investigate viral population genetics was argued (Metsky et al. 2017). Specifically, concerns were mainly focused on (1) the discrimination of intrahost variations from amplification and/or sequencing errors, (2) sensitivity and specificity for iSNV detection, (3) accuracy of variant allele frequency, and (4) amplification bias among different amplicons. Herein, we conducted this study to address the above concerns.
First, we constructed two clonal plasmids harboring a 2.5 kbp wild-type and mutant EBOV genomic segments (from the position 1, 100–3, 600 of EBOV C15 genome, GenBank accession no. KJ660346.2, Fig. 1A and Supplementary Table S1), respectively. The mutant sequence contained 71 substitutions based on the iSNVs identified in EBOV strains from Sierra Leone 2014 (according to sequences in NCBI SRA database under BioProject no. PRJNA298842, Supplementary Table S2). Then, we mixed the two clonal plasmids with four ratios (mutant:wildtype = 1:2, 1:4, 1:8, and 1:32) to mimic distinct viral populations (Fig. 1B). In order to precisely determine the mutant:wild-type ratios, all mixtures were subjected to next-generation sequencing without gene-specific amplification. The ratios (mutants accounted for 36.7% ± 0.7%, 16.1% ± 0.3%, 8.65% ± 0.27% and 1.71% ± 0.11%) calculated from the sequencing data were used as the reference. Moreover, we also diluted all the four mixtures into a higher titer (~ 1 × 10⁵ copies/μL, equivalent to ~ 25 Ct value) and a lower titer (~ 100 copies/μL, equivalent to ~ 35 Ct value) to represent regular and challenging clinical samples (Fig. 1B). For each sample, 500 ng cDNA from the human A549 cell line was added as host background. We then applied two pairs of primers, which products covered a region of ~ 2.2 kbp with a 215 bp overlap, to simulate the process of viral genome amplification (Fig. 1A). All amplicons were subjected to NGS and bioinformatic analysis. The amplified viral genomic region contained 62 of the 71 substitutions. Excluding one near the primer region, 61 substitutions were used for the following assessment (Detailed methods were described in the Supplementary Methods).

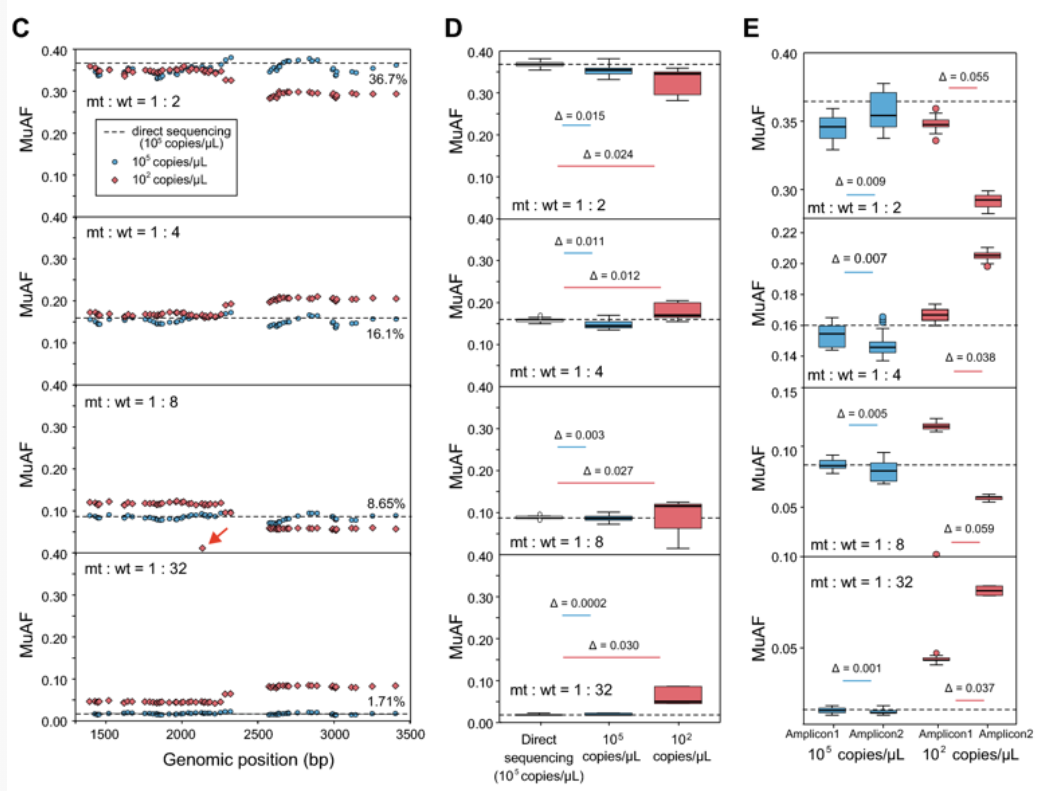
Figure 1. A The designed iSNV positions and amplicons. Two EBOV specific amplicons aligned with the genome (EBOV C15, GenBank accession no. KJ660346.2) are shown. Short vertical lines indicate the substituted sites. B Flow chart of the assay. The DNA samples extracted from wild-type (wt) and mutant (mt) clonal plasmids were mixed whth four ratios, and were diluted to two DNA concentrations (denoted by red and blue) for EBOV specific singlex amplification. The PCR products of each sample were pooled for NGS. The four mixture samples of a 105 copies μL-1 concertation were also directly sequenced. C The identified iSNVs by amplicon-seq with four mixed ratios. The dashed lines indicate the mean values of MuAF by direct sequencing, with the mutant percentages shown. Only the iSNVs with a ≥ 1% MuAF are shown, and the false positive iSNV was denoted by red arrow. D Box-plots of the MuAFs of iSNVs based on direct sequencing (white) and sequencing of the amplicons. Δ is the difference of amplicon-based median value and directly sequencing based median value. Blue box, 105 copies/μL; red box, 102 copies/μL. The same for E. E Box-plot of the MuAFs of iSNVs located in regions of amplicon 1 and amplicon 2. Δ is the difference of MuAF median values. F The variation of false positive rate in iSNV calling with threshold of MuAF at four mixed ratios. The vertical dashed lines indicate that FPRs equal 0.001, and the corresponding MuAF threshold are shown at the top. In D and E, boxes represent the interquartile range (IQR) between the first and third quartiles. Horizontal lines inside the boxes indicate the median, and the lines outside represent values within 1.5 times the IRQ
For the eight mixtures listed in Fig. 1B, we obtained an average of 51.4 Mbp (SD = 3.2 Mbp) data for each sample, and 94.4%–98.4% reads were aligned to the wildtype/mutant reference sequence (Supplementary Table S3). The on-target depth of all sites were > 17000X. We used a stringent threshold of mutated allele frequency (MuAF) ≥ 1% to identify iSNVs, according to the criteria in previous studies (e.g., MuAF ≥ 5%, Ni et al. 2016; ≥ 3%, Lakdawala et al. 2015; Poon et al. 2016; ≥ 1%, Debbink et al. 2017; Metsky et al. 2017). At this threshold, we identified all designed substitutions of the mutant in all mixed ratios irrespective of the regular or challenging viral contents (Fig. 1C). We found one false positive G-to-A substitution in the sample of the 1:8 mixtures at the lower titer. The results indicated that this approach could reach a zero false negative rate (FNR) and a zero false positive rate (FPR) for regular samples, and zero-FNR and < 0.02 FPR for challenging samples.
We then calculated the MuAFs of iSNVs for each samples, and compared them with those of the references (Fig. 1C, 1D). The box-plots of the MuAFs showed that for regular samples, the offsets of median MuAFs from the references were 0.015, 0.011, 0.003, and 0.0002 for 1:2, 1:4, 1:8, and 1:32 mixtures, respectively (Fig. 1D). The relative offset of median MuAF was around 3.9% ± 2.3% to the real MuAF (e.g., 0.015/0.367 ≈ 4.09% for 1:2 mixture). Meanwhile, for the challenging samples, the offset of the median MuAF was about 0.023 ± 0.0068, and the relative offset was 6.54%, 7.45%, 31.21%, and 175.44%. Of note, the relative offset increased dramatically when the mutant content getting lower. When compared the offset of MuAFs in each mixed ratio for regular and challenging samples, the median and standard deviation of the offset of the challenging sample were larger than those of the regular sample as expected. In summary, for samples with higher viral contents, the relative offset of MuAF of iSNV is around 5%; while for the lower viral-content samples, the relative offset was effected by the percentage of mutants, in that the mutant:wild-type ratio > 1:4 presented a ~ 10% relative offset.
We following examined the bias between the two amplicons targeting the same gene segment. For both higher and lower viral-content samples, the bias between amplicons exists (Fig. 1E). The biases of two amplicons measured by the median of MuAFs were ranged from 0.001 to 0.009 and the relative bias was 4.6% ± 1.38% (e.g., 0.009/0.367 ≈ 2.45% for 1:2 mixture) in the higher viral-content samples. The biases for the lower viral-content samples were much higher (0.037–0.059) and the relative biases were 15.0%, 23.6%, 68.2%, and 216.4% for 1:2, 1:4, 1:8, and 1:32 mixed ratios in this study. This result indicated that the bias between amplicons greatly affected the estimation of the MuAF of iSNVs for lower viralcontent samples.
We further explored the limit for iSNV identification, that is, to determine the lowest MuAF threshold, beyond which the iSNVs could be distinguished from the noise. Practically, we calculated the FPRs for iSNV calling with an increasing MuAF threshold (> 0.1% to > 1%, Fig. 1F). For the higher viral-content samples, the threshold of the MuAF could be set at as low as 0.3% to ensure a < 0.001 FPR, while for the lower viral-content samples, a 0.7% threshold and above could be used.
Generally, examining viral dynamics within-host by using iSNVs could provide critical information to know the transmission patterns and to understand the ability of natural selection shaping the viral diversity (Holmes et al. 2016). As for the EBOV outbreak in West Africa 2014, analyses of iSNVs have facilitated to unravel the transmission chains, to discover diverse selective pressures on the viral genome, and to identify the regulatory sites (Gire et al. 2014; Park et al. 2015; Ni et al. 2016). The cutoff used for these studies was MuAF ≥ 5%, and as the cutoff decreased, the numbers of observed iSNVs increased sharply (Gire et al. 2014; Park et al. 2015; Ni et al. 2016). Hence, determining the optimal threshold is of great priority for iSNV calling and the following analysis. In this study, we conducted an attempted assessment of the amplicon-based approach for iSNV identification. Our results suggested that in high viral-content samples, iSNVs with MuAF > 0.3% could be identified ideally with a < 0.001 FPR, the offset to the real MuAF was fluctuated within 7%, and the bias between amplicons was lower than 6%. While in low viral-content samples, a limited number of false positive iSNVs might appear, and the MuAF threshold of iSNV identification should not be lower than 0.7% at a > 0.001 FPR. The relative offset of MuAF and the bias between amplicons were much higher than those in high viral-content samples, especially for samples with a low fraction of mutants. Conclusively, the discovery of iSNV could reach the limit of 1% MuAF or lower in the samples of > 100 copies/μL viral contents. However, the allele frequency of iSNV should be aware of, especially in the low viral-content samples.
-
This work was supported in part by grants from the National Natural Science Foundation of China (91631110, 81571956 and U1435222). M.N was supported by the Beijing Nova Program (Z181100006218114).
HTML
Acknowledgements
-
The authors declare that they have no conflict of interest.
-
This article does not contain any studies with human or animal subjects performed by any of the authors.
Conflict of interest
Animal and Human Rights Statement
-

Table Supplementary Table S1. The mutant sequences of EBOV genome. The mutant sequences from 1, 100 bp to 3, 600 bp of EBOV genome (C15, GenBank accession: KJ660346.2). Sequences were synthesized, validated by Sanger sequencing, and cloned in plasmid pUC57

Table Supplementary Table S2. Substitutions of the mutant sequences. ORF, Open Reading Frame

Table Supplementary Table S3. Summary of amplicon-based and direct sequencing of the mixed samples. Direct-seq, direct sequencing of plasmid DNA without viral specific amplification. Amplicon-seq, sequencing of viral specific PCR products. The mutant:wild-type ratios were the designed ratios. Reference genome for alignemnt was EBOV C15 (GenBank accession no. KJ660346.2)
-
The wild-type and mutant sequences from position 1, 100 to 3, 600 of EBOV genome (GenBank accession: KJ660346.2) were synthesized, validated by Sanger sequencing, and cloned in plasmid pUC57 by Sangon Biotech Co., Ltd (Shanghai, China). The mutant had 71 substitutions corresponding to iSNV events occurred in this region among patients (Supplementary Table S1). Plasmid DNA was extracted by using Tiangen Plasmid DNA Mini Kit (Tiangen, Beijing, China) and quantified by using Qubit 2.0 Fluorometer (Invitrogen, USA). The DNA samples from mutant and wild-type were mixed with a mutant:wild-type DNA amount ratio of 1:2, 1:4, 1:8, and 1:32, respectively. Aliquots of the four mixture samples were directly sequenced as baselines. Other aliquots of the mixture samples were diluted to ~105 copies/μL (~ a 25 Ct value of EBOV viral load) and ~ 102 copies/μL (~ a 35 Ct value), respectively. Namely, there were eight samples with two viral loads at four mutant:wild-type ratios. Each diluted sample was added with 100 ng of human cDNA from A549 cell-line.
-
Amplifications were performed with two pairs of EBOV-specific primers. Primer pair 1: 5′- CCTACAAAAGACAGAACGAGGA-3′ (forward primer) and 3′-TACAAAACGGCATCAAATGGC-5′ (reverse primer). Primer pair 2: 5′-GGAACTTCTAACCGCACACC-3′ (forward primer) and 3′- TTCTAATGATTCTGATGCGATG-5′ (reverse primer). PCR amplification was performed with NEB Phusion High-Fidelity PCR Master Mix with HF Buff (New England Biolabs, USA). The regimen of thermal cycling: 3 min at 95 ℃; 25 cycles (30 s at 95 ℃, 30 s at 60 ℃, 45 s at 72 ℃), 5 min at 72 ℃. The two PCR products of the two primer pairs for each sample were pooled and cleaned with QIAquick PCR Purification Kit (Qiagen, Germany) according to the manufacturer's instructions.
-
The pooled PCR products were prepared multiplex NGS library by using Nextera XT Sample Preparation Kit (Illumina Inc., USA) according to the manufacturer's instructions. Illumina MiSeq platform was employed to generate 2 ×150-bp pair-ended reads.
-
We implemented quality control and error correction according to Schirmer et al. investigations on amplicon-seq error patterns generated by Illumina's MiSeq and Nextera XT Sample Preparation Kit (Schirmer et al., 2015). Because nucleotide-specific substitution errors are likely to enrich at both ends of reads, the first 10 bp of each read were trimmed and Sickle v1.3.3 (Joshi et al., 2011) was employed to trim the low quality bases at the end of reads with a threshold of Q20 and a requirement of 100 bp minimum read length. Following, Bayeshammer (implemented in SPAdes v3.5.0) (Nikolenko et al., 2013) was used for error correlation. Reads without their corresponding paired reads were disregarded. The remaining paired reads were used as clean reads.
Clean reads were pair-ended aligned to the reference EBOV genome (GenBank accession: KJ660346.2) by using Bowtie2 v2.2.5 (Langmead and Salzberg, 2012) with default parameters. SAMtools v1.2 (Li et al., 2009) was employed to generate 'mpileup' files with no limit of the maximum site depth. Homemade PERL scripts (available at http://github.com/generality/iSNV-calling/) were developed for iSNV calling using the mpileup files as input. The calling processes are as follows. Firstly, for each site of EBOV genome, the aligned low quality bases (< Q20) and indels were excluded to reduce possible false positive, and the site depth and strand bias were re-calculated. Then, a series of criteria were used to call iSNVs: 1) Minor allele frequency ≥ 0.1% to ≥ 1% (see text); 2) Depth of the minor allele ≥ 5; and 3) The strand bias of the minor allele was less than 10-fold. Moreover, the iSNV sites either located within the EBOV-specific primers, or the 30-bp downstream the 5′-primer, or 30-bp upstream the 3′-primer were also discarded.


 DownLoad: