


HTML
-
Seasonal influenza viruses (FLUV), one of the main agents of respiratory infections, cause annual frequent outbreaks in tropical and subtropical regions worldwide and pose huge burden to public health with 650, 000 deaths annually (Li et al. 2006; Medina and Garcia-Sastre 2011; WHO 2017). These viruses are a member of the Family Orthomyxoviridae and consist of eight segments (Bouvier and Palese 2008; Schrauwen et al. 2014). To date, three types of FLUV (A, B and C) have been defined based on their antigenic and genetic characteristics (Webster et al. 1982). The influenza A virus (FLUAV) and influenza B virus (FLUBV) are predominate types in human now. According to the two encode surface proteins hemagglutinin (HA) and neuraminidase (NA), FLUAV can be further divided into A(H3N2) and A(H1N1)pdm09; whereas FLUBV into two lineages: B/Victoria-lineage and B/Yamagata-lineage (Lamb and Choppin 1983; Schrauwen et al. 2014; Tewawong et al. 2015). In addition, FLUV can infect a wide range of age groups, with higher infection rates in children. According to the World Health Organization (WHO), about 20% of deaths among children under 5 years of age are resulted in influenza-like illnesses (ILI) (Munoz 2002; Neuzil et al. 2002; Aymard et al. 2003).
To escape the host immunity, seasonal FLUV evolve rapidly by accumulation of the point mutations in HA and NA which result in antigenic drift (Webster et al. 1982; Cox and Subbarao 2000). In the process of antigenic drift, the HA protein in FLUV experiences the strongest positive selection as it contains antigenic epitopes and is also potential target for neutralizing antibodies (Wiley et al. 1981; Bush et al. 1999; Wang et al. 2008; Deem and Pan 2009). In addition, the point mutations on NA protein may also affect the antiviral susceptibility to the neuraminidase inhibitors (NAIs) drugs (Pozo et al. 2013).
Vaccines are currently an effective means of preventing the infection of FLUV. However, because antigenic drift drives the mutation in the HA gene and especially at the antigenic epitopes and receptor binding sites, the complete protection against influenza is hard to achieve. Therefore, it is particularly important to keep evaluating the compatibility between the vaccine strain and contemporary field strains.
Wuhan is the capital city of Hubei Province and is located in central China. It belongs to the north subtropical climate and have a population over 10, 760, 000 (He and Tao 2018). In addition, in the 2017–2018 influenza season, the seasonal influenza A(H3N2) viruses resulted in the abrupt increase in hospitalization fatality rates in Hong Kong, which is the second-highest recorded number of influenza cases in China since the pandemic H1N1 FLUV in 2009 (Gao 2018). Hence, in this study, we surveyed seasonal influenza strains circulating in Wuhan around this special period (during 2016–2019). Additionally, we analyzed the antigenic characteristics and evaluated the effectiveness of vaccine.
-
Fresh throat swabs were collected from influenza-like illness (ILI) outpatients in Zhongnan Hospital of Wuhan University from June 2016 to May 2019. The collection of clinical specimens strictly followed the case definitions of ILI established by the WHO: sudden onset of fever > 38 ℃, cough or sore throat, and absence of other diagnoses (WHO 2014).
-
The Influenza A & B Test (Wondfo, China) was carried out according to the manufacturer's instructions for the rapid differential diagnosis of FLUAV and FLUBV infections. The influenza-positive specimens were then subjected to subtyping using the primers sets designed for each type of HA and NA genes. Total RNA was extracted from 250 μL of fresh throat swabs, using TRIzol LS Reagent (Invitrogen, Carlsbad, CA, USA) according to the manufacturer's instruction. For subtyping of influenza virus, we used PanFLUAV and FLUBV primer sets that target at the conserved region of the HA and NA genes. Nested reverse transcription PCR (RT-PCR) were carried out by using PrimeScriptTM One Step RT-PCR Kit Ver.2 (Takara, Japan) and 2× EasyTaq® PCR Super Mix (Transgen, China). PCR products were visualized on a 1% agarose gel and target bands were selected for sequencing. Finally, because of the high homology between the influenzapositive strains, a total of 28 positive strains representative for the influenza season and genetic diversity were selected from all the influenza-positive strains for full genome sequencing. The primer sets for full coding regions sequencing were designed based on conserved noncoding regions at both ends of each gene segment (Hoffmann et al. 2001).
-
For phylogenetic analyses, we downloaded the reference strains and vaccine strains from the GISAID databases (https://www.gisaid.org). The viral sequences were aligned using the Mafft program (Katoh and Standley 2013). The phylogenetic trees of HA were then generated by the maximum likelihood (ML) method using the GTR+nucleotide substitution model and a Subtree Pruning and Regrafting branch-swapping algorithm with 1000 bootstrap replications implemented in PhyML version 3.0 (Guindon et al. 2010). Finally, the complete coding region sequences of eight segments of A(H3N2), A(H1N1)pdm09 and FLUBV obtained in this study were submitted to GenBank and assigned accession numbers are MN594836MN595013 for FLUAV and MN594824–MN594833 for FLUBV. The amino acid residues in the epitopes of A(H3N2), A(H1N1)pdm09 and FLUBV were previously identified (Wiley et al. 1981; Bush et al. 1999; Wang et al. 2008; Deem and Pan 2009). The relative amino acid frequency in the epitope of HA1 was performed using WebLogo (Crooks et al. 2004).
-
The pepitope model was utilized to estimate the efficacy of vaccine. The antigenic distance to the vaccine strain was measured by pepitope, which is calculated by the fraction of amino acid substitutions in the dominant HA epitope (Gupta et al. 2006; Pan et al. 2011). The pepitope value was then translated into vaccine efficacy using E=-2.47 × pepitope + 0.47 for A(H3N2) virus and E=-1.19 × pepitope + 0.53 for A(H1N1)pdm09 virus. When the pepitope=0, the A(H3N2) virus vaccine efficacy was 47% which suggests a perfect match between the vaccine and virus. For A(H1N1)pdm09 virus, the vaccine efficacy is 53% when the pepitope =0.
Clinical Specimen Collection
FLUV Detection, Subtyping and Full Genome Sequencing
FLUV Sequence Data and Phylogenetic Analyses
Estimation of Vaccine Efficacy Using the pepitope Model
-
During 2016–2019, a total of 44, 738 throat swab samples from patients were received for confirming the respiratory viruses in laboratory, among which 6933 samples (15.5%) were tested positive for FLUAV and 2747 samples (6.1%) positive for FLUBV. In addition, co-infection of both FLUAV and FLUBV were found in 134 samples (0.3%). The age structure of the influenza positive patients was summarized in Table 1. These patients comprised five age groups: < 2 years, 2–4 years, 5–14 years, 15–64 years and > 64 years. Obviously, the age of 5–14 years had higher prevalence rate for FLUAV and FLUBV based on this study. Of the 6933 samples which were positive for FLUAV, the detection rate was highest in 5–14 years (37.2%), followed by 2–4 years (36.2%), 15–64 years (18.9%), < 2 years (6.5%) and > 64 years (1.25%). Among the 2747 FLUBV positive samples, the prevalence was highest in 5–14 years (51.0%), followed by 2–4 years (22.4%), 15–64 years (20.6%), < 2 years (4.2%) and > 64 years (1.9%). In co-infected samples, the 5–14 years group was up to 50.75%. Finally, significant differences in the distribution by age groups (P < 0.0001) were found between influenza types. In summary, during 2016–2019, infected population mainly concentrated in 5–14 years, and the FLUAV (15.5%) was the most dominant type, although FLUBV (6.1%) also took a significant proportion.
2016.6–2017.5 2017.6–2018.5 2018.6–2019.5 Total P value Received samples (n) 4983 16, 625 23, 130 44, 738 Influenza type A B A + B A B A + B A B A + B A B A + B Age 741 (14.9) 213 (4.7) 16 (0.3) 2617 (15.7) 1332 (8.0) 60 (0.4) 3575 (15.5) 1202 (5.2) 58 (0.3) 6933 (15.5) 2747 (6.1) 134 (0.3) < 2 years 25 (3.4) 4 (1.9) 1 (6.3) 131 (5.0) 36 (2.7) 2 (3.3) 295 (8.3) 74 (6.2) 5 (8.6) 451 (6.5) 114 (4.2) 8 (6.0) P < 0.0001 2–4 years 286 (38.6) 64 (30.1) 7 (43.8) 991 (37.9) 331 (24.9) 21 (35.0) 1231 (34.4) 221 (18.4) 19 (32.8) 2508 (36.2) 616 (22.4) 47 (35.1) 5–14 years 372 (50.2) 131 (60.5) 7 (43.8) 889 (34.0) 696 (52.3) 31 (51.7) 1316 (36.8) 573 (47.7) 30 (51.7) 2577 (37.2) 1400 (51.0) 68 (50.8) 15–64 years 56 (7.6) 14 (6.6) 0 (0.0) 568 (21.7) 240 (18.0) 3 (5.0) 686 (19.2) 311 (25.9) 4 (6.9) 1310 (18.9) 565 (20.6) 7 (5.2) > 64 years 2 (0.3) 0 (0.0) 0 (0.0) 38 (1.5) 29 (2.2) 3 (5.0) 47 (1.3) 23 (1.9) 0 (0.0) 87 (1.3) 52 (1.9) 3 (2.2) A + B: Co-infection with FLUAV and FLUBV.
P < 0.0001: Differences in the distribution by age groups were found between FLUAV and FLUBV.Table 1. Prevalence of FLUV in Wuhan city, Hubei province, China during 2016–2019.
During study period, three influenza seasons could be further divided as shown in Table 1. Notably, single influenza peaks during winter months were found in 2017–2018 and 2018–2019, respectively (Fig. 1). In addition, a small peak was also found in August and September of 2017. However, because of the small number of samples during winter in 2016, a small influenza peak was only observed in March of 2016. Although the influenza peak was mainly in winter, a few sporadic cases were also found during the inter-season periods. In addition, the dominant type was also variable during the three influenza seasons. For example, during 2017–2018 influenza season, FLUAV was the main epidemic strain at first, followed by FLUBV, and finally returned to FLUAV. While, in this study, the FLUAV was always dominant during 2018–2019 influenza season.
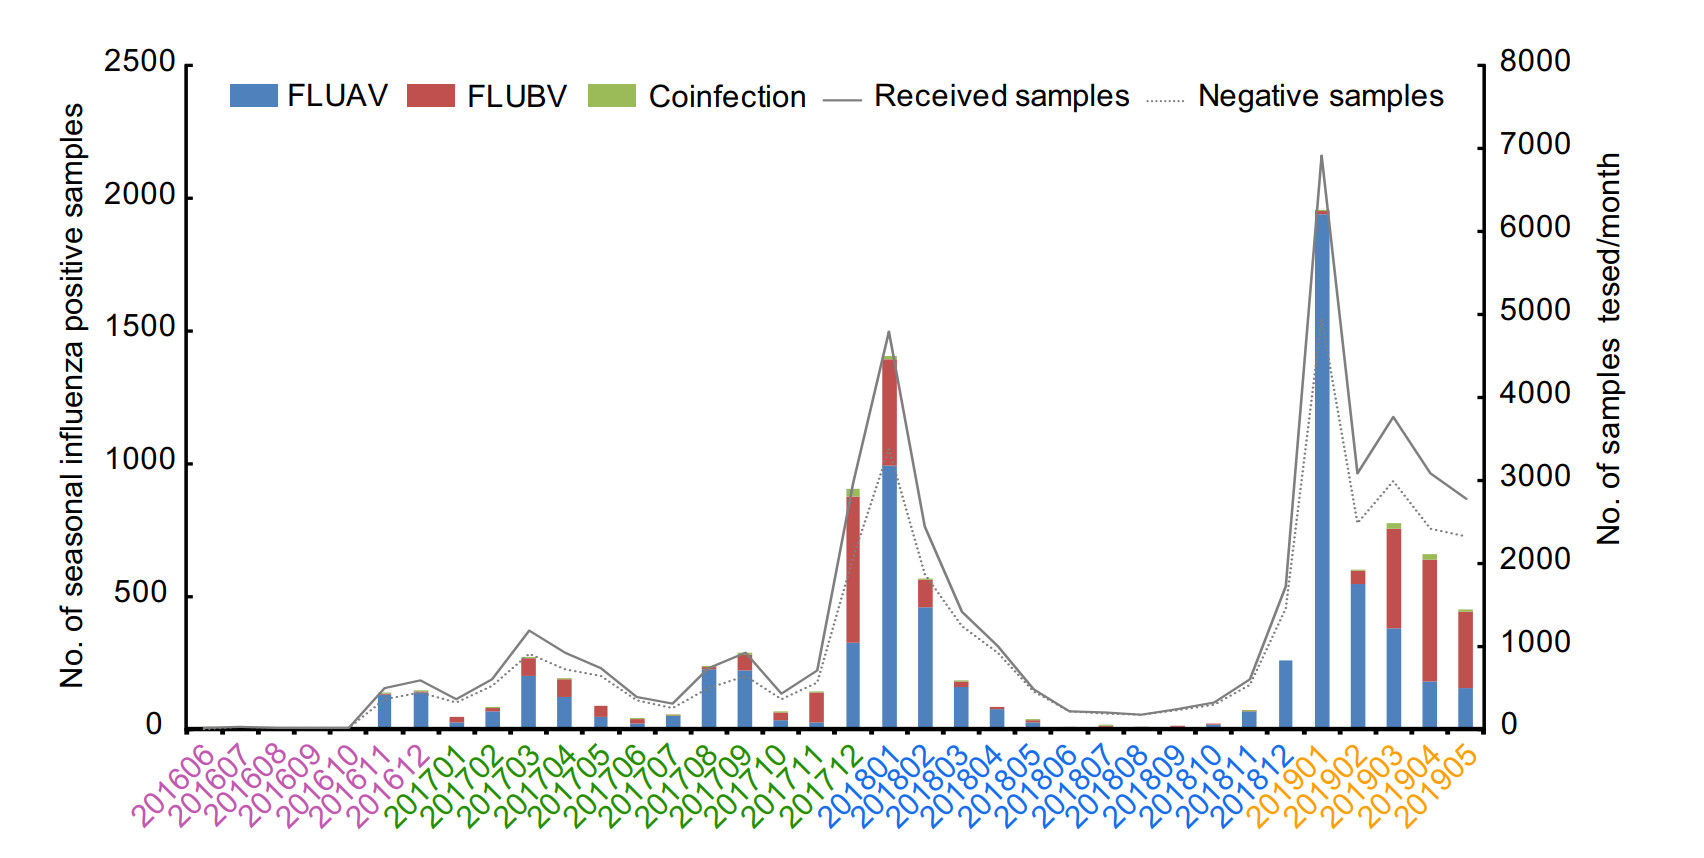
Figure 1. Distribution of influenza-like illnesses (ILI) cases and the prevalence of different influenza types from June 2016 to May 2019.
-
To assess the evolution of seasonal FLUV in Wuhan city during the three influenza seasons, 12 A(H3N2), 11 A(H1N1)pdm09 and 5 FLUBV coding region sequences were recovered from the influenza-positive samples. The HA phylogenetic trees not only included the strains obtained in this study, but also included the circulating strains in China during the same period, the representative strains of clades for seasonal FLUV and the vaccine sequences recommended for northern hemisphere 2017–2020 influenza season.
As shown in Fig. 2, although all A(H3N2) strains were belonged to clade 3C.2a, they fell into two clusters: subclade 3C.2a2 and 3C.2a1b. In the subclade 3C.2a2, these strains shared the amino acid substitutions T147K, R158K and Q327H. Similarly, all the strains have the amino acid substitution R158G in subclade 3C.2a1b. Notably, compared with these 2017 and 2019 strains, the 2018 strains fell into two clades, highlighting the extensive diversity of A(H3N2) in Wuhan city during 2018. However, these strains from 2018 shared 98.3%–99.8% nucleotide and 98.1%–99.8% amino acid identities in HA gene with the vaccine strain recommended for northern hemisphere 2018–2019 influenza season (A/Singapore/INFIMH-160019/2016) (Table 2). Meanwhile, these 2019 strains from Wuhan and Hong Kong were clustered together and they shared the mutation of E78G. Finally, the overall HA1 nucleotide and amino acid identities among A(H3N2) to the corresponding vaccine strains were all over 96%.
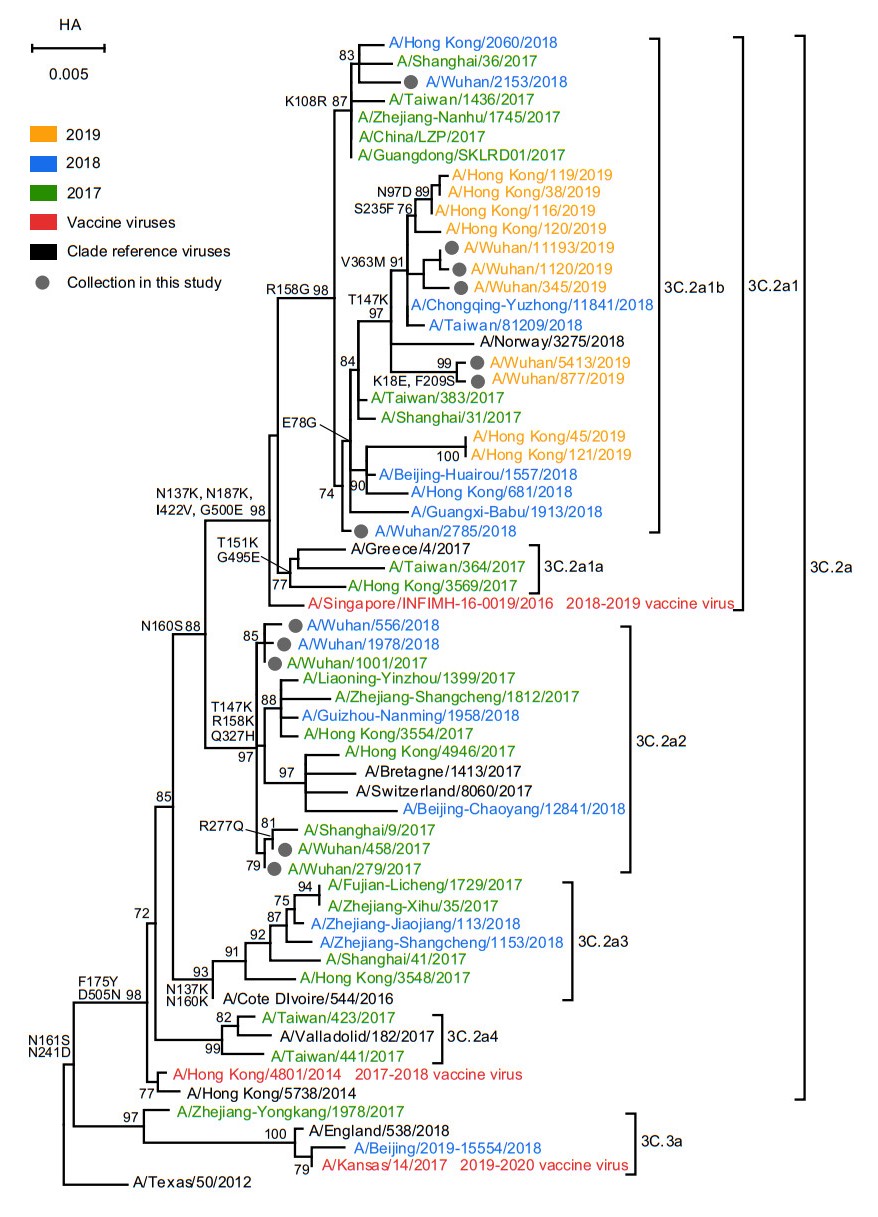
Figure 2. Phylogenetic analysis of the nucleotide sequences of the HA gene of influenza A(H3N2). The tree was rooted with A/Texas/50/2012. Statistical support values (> 70%) are shown for significant nodes. The conserved amino acid changes to some clades were indicated at relevant branches. The scale bar indicates nucleotide substitutions per site. The GISAID Epiflu ID or GenBank accession numbers of FLUV used in this analysis are shown in Supplementary Table S4.
Type Year Clade No. of strain Vaccine strain % identity of HA Nucleotide Amino acid A/H3N2 2017 3c.2a2 3 A/Hong Kong/4801/2014 98.9–99.9 98.8–100 2018 3c.2a2, 3c.2a1b 4 A/Singapore/INFIMH-16-0019/2016 98.3–99.8 98.1–99.8 2019 3c.2a1b 5 A/Kansas/14/2017 96.3–100 96.5–99.9 A/H1N1 2018 6b.1 6 A/Michigan/45/2015 98.4–99.7 98.9–99.8 2019 6b.1 5 A/Brisbane/02/2018 98.0–98.9 98.1–98.9 B/Yamagata 2018 3 3 B/Phuket/3073/2013 98.4–99.9 99.5–99.8 2019 3 2 B/Phuket/3073/2013 98.4–99.9 99.1–99.7 Table 2. Comparison of nucleotide and amino acid similarities between the vaccine and the circulating seasonal influenza strains in Wuhan city, Hubei province, China.
The phylogenetic analysis of HA gene of A(H1N1)pdm09 and FLUBV was shown in Figs. 3 and 4. All A(H1N1)pdm09 isolated from Wuhan city clustered with 6B.1 based on the amino acid substitutions A13T, S101N, S179N and I233T. Interestingly, two 2018 strains (A/Wuhan/378/2018 and A/Wuhan/854/2018) and one 2019 strain (A/Wuhan/899/2019) were clustered with the 2019–2020 vaccine virus A/Brisbane/02/2018 which shared the amino acid substitution S200P. However, the HA1 nucleotide and amino acid identities among the A(H1N1)pdm09 and the vaccine virus of that year are all over 98% (Table 2). In addition, same as A(H1N1)pdm09, there were no FLUBV identified in 2016–2017 influenza season. The 2017–2018 and 2018–2019 strains all belong to B/Yamagata-lineage and fell into clade 3, sharing the amino acid substitutions N131K, K313E and E327K. They also shared > 98% nucleotide and amino acid identities with vaccine virus of that year.
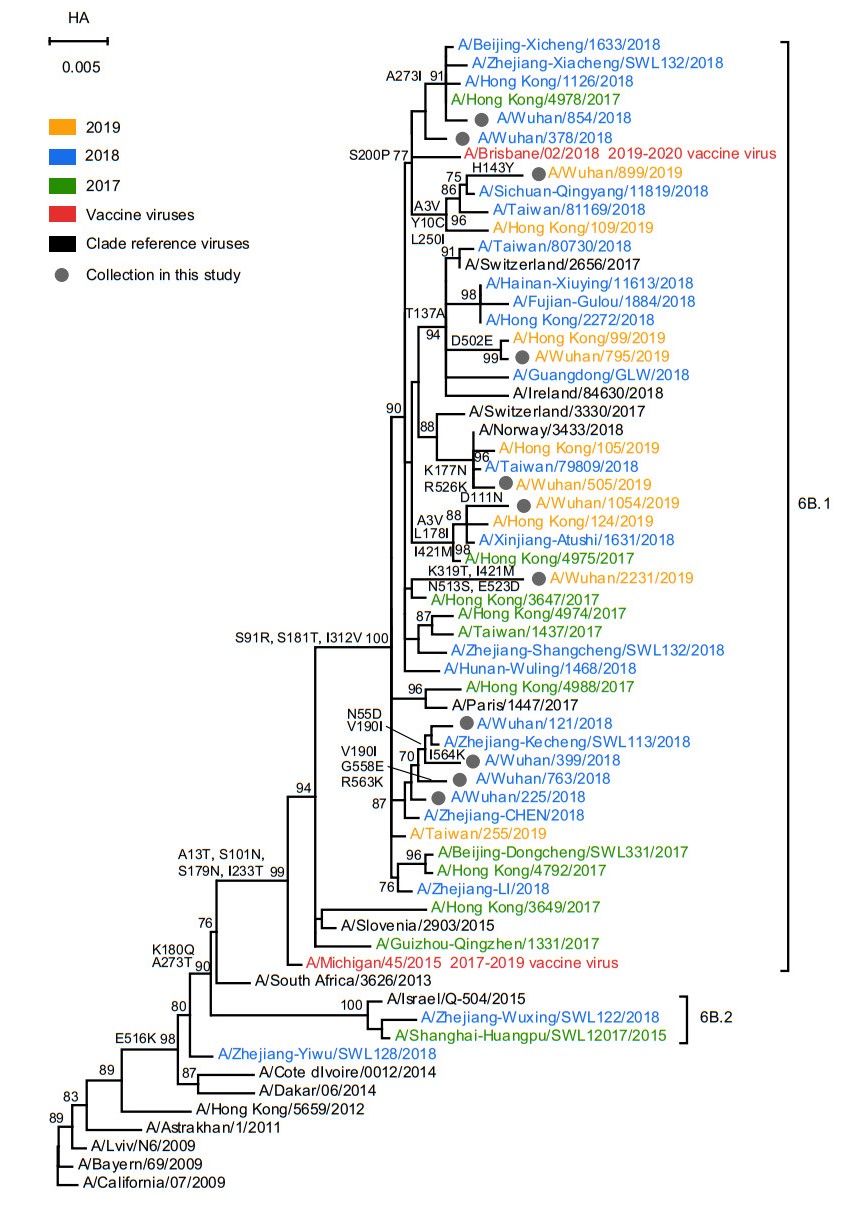
Figure 3. Phylogenetic analysis of the nucleotide sequences of the HA gene of influenza A(H1N1)pdm09. The tree was rooted with A/California/07/ 2009. Statistical support values (> 70%) are shown for significant nodes. The conserved amino acid changes to some clades were indicated at relevant branches. The scale bar indicates nucleotide substitutions per site. The GISAID Epiflu ID or GenBank accession numbers of FLUV used in this analysis are shown in Supplementary Table S4.

Figure 4. Phylogenetic analysis of the nucleotide sequences of the HA gene of FLUBV. The tree was rooted with B/Estonia/ 55669/2011. Statistical support values (> 70%) are shown for significant nodes. The conserved amino acid changes to some clades were indicated at relevant branches. The scale bar indicates nucleotide substitutions per site. The GISAID Epiflu ID or GenBank accession numbers of FLUV used in this analysis are shown in Supplementary Table S4.
-
To describe the antigenic characterization of A(H3N2), A(H1N1)pdm09 and FLUBV in Wuhan city during 2016–2019, we summarized the relative frequencies of amino acid substitutions at the epitope domain of the HA1 in comparisons with the vaccine strains of 2017 (Fig. 5). Because of no changing residues found on the epitope of FLUBV, it was not shown in Fig. 5. The antigenic sites A–E on the HA1 of A(H3N2) and A(H1N1)pdm09 viruses have been described preciously (Wiley et al. 1981; Bush et al. 1999; Deem and Pan 2009). Analyses of HA1sequneces of A(H3N2) viruses revealed 13 amino acid variations at the five epitopes: 131, 135 and 142 at epitope A; 160, 193 and 194 at epitope B; 311 at epitope C; 96, 121 and 171 at epitope D and 62, 92 and 261 at epitope E. In addition, there were also 14 amino acid variations at the five epitopes of A(H1N1)pdm09 viruses: 120, 126 and 129 at epitope A; 160, 183 and 185 epitope B; 38, 295 and 302 epitope C; 94, 164 and 173 epitope D and 74 and 260 at epitope E. However, no changing residues was found on receptor binding sites (RBSs) of A(H3N2) and A(H1N1)pdm09. Hence, the A(H1N1)pdm09 strains exhibited more diversity than the A(H3N2) strains in this study.

Figure 5. Frequency of amino acid residues discovered on epitopes A-E in HA1 protein of A(H3N2) and A(H1N1)pdm09 identified in Wuhan city during 2017-2019. The graphics were generated by using WebLogo3 (http://weblogo.threeplusone.com/). Positions of residue along the x-axis for (A) A(H3N2) and (B) A(H1N1)pdm09 are based on the A/Hong_Kong/4801/2014 and A/Michigan/45/2015 strains, respectively. Relative frequency of the amino acid residue is proportional to the residue height.
-
The amino acid changes on NA and M proteins are related to resistance against the two known classes of drugs: neuraminidase inhibitors (NAIs) and adamantanes (Hurt et al. 2016). However, no amino acids changes were found on the special sites which reduces the susceptibility of NA inhibitors in this study (Supplementary Table S1, S2 and S3). In addition, the amino acid changes at the positions 26, 27, 30 and 31 of M2 protein which were proved to resistance to adamantanes were also not found in this study (Horm et al. 2014).
-
To estimate vaccine compatibility of viruses circulating in Wuhan city during 2016–2019, the pepitope model was used to evaluate the antigenic distance between viruses identified in this study and the contemporary vaccine strain (Tables 3 and 4). Amino acid residues in five epitope regions A to E possess 19, 21, 27, 41 and 22 amino acids in HA1 of H3N2, respectively. For 2017, the pepitope between A(H3N2) and the A/Hong Kong/4801/2014 vaccine strain was 0.1053 (epitope A; mutation 131 and 142) and the vaccine efficacy was 44.66% (E=20.99% of 47%, pepitope=0) with a perfect match with the vaccine strain. For 2018, the HA1 sequences mostly had a dominant mutation in epitope A (131, 142 and 171). The pepitope of 0.1579 with respect to A/Singapore/INFIMH-16-0019/ 2016 vaccine strain and the vaccine efficacy was 17.02% (E=8.00% of 47%, pepitope=0) with a perfect match with the vaccine strain. Similarly, for 2019, the pepitope was also 0.1579 from 5 strains (dominant epitope A, mutations 131, 138 and 144) between A(H3N2) and A/Kansas/14/2017 vaccine strain, suggesting the poorly matched with vaccine strain. Consequently, the strains isolated in Wuhan city during the three influenza seasons have a worse-case vaccine efficacy, especially for 2018 and 2019.
Year Vaccine strain No. of strain Dominant epitope Differing Residues pepitope Efficacy Vaccine efficacy (47%) Vaccine efficacy (100%) 2017 A/Hong Kong/4801/2014 3 A 131, 142 0.1053 0.2099 20.99 44.66 2018 A/Singapore/INFIMH-16-0019/2016 2 A 131, 142, 171 0.1579 0.0800 8.00 17.02 1 A 135, 142 0.1053 0.2099 20.99 44.66 1 A 135 0.0526 0.3401 34.01 72.34 2019 A/Kansas/14/2017 5 A 131, 138, 144 0.1579 0.0800 8.00 17.02 Table 3. Efficacy among the vaccine strains and number of mutations found on the dominant epitope of A(H3N2) isolated in Wuhan city, Hubei province, China.
Year Vaccine strain No. of strain Dominant epitope Differing Residues pepitope Efficacy Vaccine efficacy (53%) Vaccine efficacy (100%) 2018 A/Michigan/45/ 2015 2 C 38, 295 0.0606 0.4579 45.79 86.40 2 B 183 0.0455 0.4759 47.59 89.79 1 C 295 0.0303 0.4939 49.39 93.19 1 D 164, 173 0.0417 0.4804 48.04 90.64 2019 A/Brisbane/02/ 2018 3 C 45, 298 0.0606 0.4579 45.79 86.40 1 C 45, 298, 302 0.0909 0.4218 42.18 79.59 1 B 160, 185 0.0909 0.4218 42.18 79.59 Table 4. Efficacy among the vaccine strains and number of mutations found on the dominant epitope of A(H1N1)pdm09 isolated in Wuhan city, Hubei province, China.
In addition, according to the previous report, amino acid residues in epitope A to E of H1N1 possess 24, 22, 33, 48 and 34 amino acids, respectively. As shown in Table 4, antigenic drifts were mainly on epitopes B and C. The dominant epitope was C which substitution were 38, 295 and the pepitope was 86.40% (E=45.79% of 53%, pepitope =0) when perfect matching the vaccine strain. For 2019, the HA1 sequences of A(H1N1)pdm09 showed antigenic drifts mainly on epitopes C with mutations 45 and 298. The vaccine efficacy was 86.40% (E=45.79% of 53%, pepitope=0). Finally, these results revealed that the protective effect of A(H1N1)pdm09 vaccine is better than A(H3N2) in Wuhan city during 2016–2019.
Epidemiological Surveillance and Temporal Distribution of FLUV
Phylogenetic Analysis of FLUV
Antigenic Characterization of FLUV
Antiviral Drug Susceptibility Profile of FLUV
Vaccine Compatibility of FLUV
-
In China, different circulation patterns of seasonal influenza were shown in southern and northern: two distinct peaks (winter and summer) in southern China and only one single peak of winter in northern China (Shu et al. 2010). In Wuhan, which represents the central China, influenza epidemic presents double peaks in winter and summer in Wuhan during 2012–2017 (He and Tao 2018; Wang et al. 2018). However, in this study, only a small single peak was found in winter of 2016 which may be due to lack of samples (Fig. 1). Additionally, in the 2017–2018 influenza season, a distinct single peak was observed in winter, while a small peak in summer. Notably, there was only one influenza peak in winter during the influenza season 2018–2019, suggesting that a complex patterns of influenza seasonality in Wuhan. Furthermore, schools are the main source of influenza-like outbreaks place and the similar events had occurred in Wuhan during 2012–2016 (Wang et al. 2017; Wang et al. 2018). In this study, we also found the majority of influenza cases during 2016–2019 in Wuhan were school-aged children, which indicated that it is necessary to strengthen the surveillance of influenza-like cases in primary and secondary schools and kindergartens.
Notably, during the three influenza seasons, the FLUAV co-circulated with the FLUBV and sometimes co-infection occurs in Wuhan (Table 1). To response to host immune selection pressure, antigenic drift occurs on average 2–8 years and compared with FLUBV and FLUAV (H1N1), FLUAV (H3N2) is most frequently (Bedford et al. 2015). In this study, we also identified a shift in the subtypes of A(H3N2) from subclade 3c.2a2 to 3c.2a1b which is marked by amino acid substitution R158G. Furthermore, two subclades were detected simultaneously in 2018, indicative of a clear transition. Compared with the A(H3N2) strains isolated in Hong Kong during 2017–2018 influenza season, no 121 K mutation were found in A(H3N2) strains circulating in Wuhan (Cheung et al. 2017). In contrast, the circulating A(H1N1)pdm09 and FLUBV in Wuhan were relatively stable. However, the A(H1N1)pdm09 displayed more diversity on the epitope mutations than A(H3N2) (Fig. 5).
As previously reported, vaccination could reduce the risk for influenza-associated hospitalization and even deaths in children, pregnant women and the person with heart disease (Udell et al. 2013; Flannery et al. 2017; Thompson et al. 2019). However, because of the antigenic drift, effectiveness of seasonal influenza vaccine varies by season. During 2016–2019, the dominant epitope of A(H3N2) is always A, but the vaccine strains changed from A/Hong Kong/4801/2014 for 2017–2018, A /Singapore/ INFIMH-16-0019/2016 for 2018–2019 to A/Kansas/14/ 2017 for 2019–2020. Regretfully, the percentage of perfect-match vaccine efficacy has not been improved, but declined from 44.66% to 17.02%. This was consistent with the substantial increase of the number of FLUAV in winter of 2017–2018 and 2018–2019 influenza season (Fig. 1). In contrast, the percentage of perfect-match vaccine efficacy of A(H1N1)pdm09 is always over 80%, and therefore, it could provide better protection. Taken together, the seasonal influenza in Wuhan during 2016–2019 is characterized by variable seasonal patterns and multiple influenza types. Although FLUAV dominated this period, vaccine protection especially A(H3N2) was poor. Hence, surveillance of A(H3N2) vaccine strain should be strengthened in Wuhan to prevent large-scale influenza outbreak in Wuhan.
-
This study was supported by the Fundamental Research Funds for the Central Universities and the National key research and development program of China (2018TFE0204500).
-
YRL and WH designed the studies. LJC and JJG performed the experiments. WWG, EXS, XW, KJL and JY collected samples and performed the statistical analysis. LJC and JJG wrote the manuscript. YRL, WH and MS contributed to manuscript revision. All authors read and approved the final manuscript.
-
The authors declare no competing conflicts of interest.
-
This study was approved by the Ethics Committee of the Zhongnan Hospital of Wuhan University. Additional informed consent was obtained from all patients for which identifying information is included in this article. Data were collected from the electronic patient record.


 DownLoad: