


HTML
-
Since December 2019, severe acute respiratory syndrome coronavirus 2 (SARS-CoV-2) pneumonia has spread rapidly in China and soon after around the world. It has been declared by WHO as a global public health emergency and named as Coronavirus disease 2019 (COVID-19) on January 13, 2020 (Huang et al. 2020; Zhou et al. 2020b; Zhu et al. 2020). As of July 08, 2020, there have been about 11, 669, 259 confirmed cases, and 539, 906 deaths caused by the COVID-19 (WHO 2020a).
The clinical spectrum of patients with COVID-19 varies from asymptomatic infection, mild discomfort to severe viral pneumonia with respiratory failure and even death (Chen et al. 2020; Wang et al. 2020). The symptoms and clinical features of patients with COVID-19 include lower respiratory tract illness with fever, dry cough and dyspnea. These symptoms are similar to those of two other diseases caused by coronaviruses: severe acute respiratory syndrome (SARS) and Middle East respiratory syndrome (MERS) (Tsang et al. 2003; Assiri et al. 2013).
Prompt and accurate diagnosis is the first and vital step to effectively control the ongoing outbreak of emerging COVID-19 epidemics (Sridhar et al. 2015; Yang et al. 2020). The radiological characteristics of patients with COVID-19 pneumonia are diverse, from nondistinctive features, diffuse changes, to destruction of the pulmonary parenchyma (Shi et al. 2020). However, the evidences based on radiological characteristics alone are not sufficient to confirm the virus. One commonly accepted clinical method in confirming infected cases of COVID-19 is based on detection of unique sequences of virus RNA via quantitative reverse transcriptase polymerase-chain-reaction (qRT-PCR), which has the advantages of high-accuracy and high specificity.
However, there is still a possibility that false-negative results might occur due to the low viral loads of the samples (To et al. 2020; Zou et al. 2020). Measurement of anti-SARS-CoV-2 antibodies theoretically could remedy the detection of nucleic acid and be used for retrospective diagnosis and contact tracing. Therefore, in the present study, we retrospectively analyzed the sensitivities and dynamics of IgG and IgM antibodies detected by ELISA in COVID-19 patients at early stage of outbreak in Wuhan, as to provide early diagnosis information in this field.
-
This single-center, retrospective study was conducted at Jin-Yin-Tan Hospital (Wuhan, China), which is a designated hospital to treat COVID-19 patients. We recruited 131 patients who had been diagnosed with COVID-19 before 15 January 2020. According to WHO interim guidance, at least one-time antibody detection was done during their hospitalization (WHO 2020b).
-
Anti-SARS-CoV-2 IgG and IgM antibodies in serum samples of COVID-19 patients were detected with the serological methods as reported previously, which showed no cross-reactivity with other commonly circulating human coronaviruses (e.g. HCoV-OC43) (Kissler et al. 2020). In-house anti-SARS-CoV-2 IgG and IgM ELISA kits were developed using SARSr-CoV Rp3 nucleocapsid protein (NP) as antigen, which is > 90% amino acid identity compared to reported SARSr-CoVs (Wang et al. 2018; Zhou et al. 2020a). For IgG test, MaxiSorp Nunc-immuno 96 well ELISA plates were coated with 100 ng/well of recombinant NP overnight, then incubated with human sera in duplicates at a dilution of 1:20 for an hour at 37 ℃, and followed by detection with anti-Human IgG-HRP conjugated monoclonal antibody (Kyab Biotech Co., Ltd, Wuhan, China) at a dilution of 1:40, 000. For IgM test, MaxiSorp Nunc-immuno 96 well ELISA plates were coated with 500 ng/well anti-human IgM (µ chain) overnight, then incubated with human sera in duplicates at 1:100 dilution for 40 min at 37 ℃, and followed by detection with anti-Rp3 NP-HRP conjugated antibody (Kyab Biotech Co., Ltd, Wuhan, China) at a dilution of 1:4000. The OD values of 450–630 nm were calculated. 240 random negative control samples and two SARS-CoV-2 positive control samples were used to set the cutoff values of IgG and IgM. According to the Kit instruction, we used the mean OD value of the negative control samples plus three standard deviations to set the cutoff values of IgG and IgM at 0.143 and 0.142, respectively. The specificity of these positive samples was confirmed by Western blot with recombinant Rp3 NP.
-
All the clinical data on epidemiology, including exposure history, symptoms, underlying comorbidities and laboratory results were retrospectively extracted from electronic medical records. The date of disease onset was defined as the day when the symptom was noticed. All CT images were reviewed by two experienced radiologists, and decisions were reached by consensus agreement.
-
All statistical analyses were performed with SPSS software (version 20.0, IBM, Armonk, NY). Continuous normally distributed variables were presented as $\bar{x}$ ± SD, non-normally distributed data and categorical variables are shown as frequencies and percentages. Statistical analyses were done by one-way analysis of variance (ANOVA) for numerical data and Chi Square Test for multiple comparisons of categorical data. P value of less than 0.05 was considered statistically significant.
Study Design and Participants
Serological Tests for Anti-SARS-CoV-2 Antibodies
Collection of Clinical Data and Evaluation of Chest CT
Statistical Methods
-
Table 1 presents the demographic and clinical characteristics of the 131 confirmed cases (69% male, 31% female), who were admitted to Jin-Yin-Tan Hospital between 30 December, 2019 and 15 January, 2020 with mean 9 (± 3.9) days after onset of symptom. The average age was 51.4 (± 11.8) years and 17.5% patients were older than 60. All patients were residents of Wuhan or surrounding areas. 75 (57%) patients had a history of exposure to the Huanan Seafood Market, 12 (9%) cases had exposure to patients with confirmed or highly suspected COVID-19, and 9 (7%) patients were clustered onset. Among those 131 patients, 55 (42%) had underlying chronic diseases, including 31 (24%) hypertension, 14 (11%) diabetes and 7 (5%) with chronic heart disease.
Clinical characteristics (n = 131) Sex (Male/Female) 90 (68.7%)/41 (31.3%) Age, years 51.4 ± 11.8 (24–81) Age range, years 24–39 19 (14.5%) 40–59 76 (58.0%) 60–79 35 (16.7%) ≥ 80 1 (0.8%) Days from onset to hospitalization 9.04 ± 3.93 (1–24) Time of staying in hospital (days) 18.26 ± 10.06 (4–72) Normal/severe/critical cases 15 (11.4%)/82 (62.6%)/34 (26.0%) Comorbidities 55 (42%) Hypertension 31 (23.7%) Diabetes mellitus 14 (10.7%) Heart disease 7 (5.3%) Epidemiologic history History of residence or travel 131 (100%) Exposure to Huanan Seafood Wholesale Market 75 (57.3%) History of contacting with COVID-19 patients 12 (9.2%) Clustered onset 9 (6.9%) Onset symptoms Fever 124 (94.7%) Cough 96 (73.3%) Dyspnea 50 (38.2%) Fatigue 43 (32.8%) Shortness of breath 33 (25.2%) Gasping 22 (16.8%) Muscle ache 20 (15.3%) Headache 15 (11.5%) Chill 12 (9.2%) Chest pain 7 (5.3%) Nausea 5 (3.8%) Dizziness 5 (3.8%) Sore throat 4 (3.1%) Runny nose 4 (3.1%) Difficulty breathing 4 (3.1%) Joint soreness 4 (3.1%) Palpitations 3 (2.3%) Vomit 3 (2.3%) Shivering 3 (2.3%) Diarrhea 2 (1.5%) Treatment Glucocorticoids 64 (48.9%) Immunoglobulin 19 (14.5%) High-flow Nasal Cannula 33 (25.2%) Non-invasive ventilation 16 (12.2%) Invasive ventilation 7 (5.3%) Extracorporeal membrane oxygenation 4 (3.1%) Renal replacement therapy 6 (4.6%) Blood transfusion 4 (3.1%) Vasoconstrictive agents 4 (3.1%) Complication 72 (55.0%) Liver dysfunction 48 (36.6%) Acute respiratory distress syndrome 40 (30.5%) Hypoproteinemia 34 (26.0%) Sepsis 18 (13.7%) Thrombocytopenia 16 (12.2%) Acute kidney injury 13 (9.9%) Septic shock 11 (8.4%) Acute myocardial injury 9 (6.9%) In-hospital mortality 15 (11.5%) Table 1. Demographics and clinical characteristics of the included patients.
The most common symptoms at admission were fever (124, 94.7%), cough (96, 73.3%) and dyspnea (50, 38.2%). A few patients presented atypical onset symptoms, including headache (15, 12%), dizziness (5, 4%), nausea (5, 4%), vomit (3, 2%) and diarrhea (2, 1.5%). Almost half of the patients (64, 49%) received glucocorticoids, 19 (14.5%) cases received human immunoglobulin; 33 (25.5%) patients were treated with high-flow nasal cannula, 23 (17.6%) with mechanical ventilation, 4 (3.1%) with extracorporeal membrane oxygenation (ECMO), 6 (4.6%) with renal replacement therapy, and 4 (3.1%) with vasoconstrictive agents.
More than half (72, 55.5%) of the patients had damage in organ function, including 48 (36.6%) with liver dysfunction, 40 (30.5%) with ARDS, 13 (9.9%) with acute kidney injury, 11 (8.4%) with septic shock, and 9 (6.9%) with acute cardiac injury. Most of the patients (82, 62.6%) were severe cases and a quarter of patients were critical cases according to the clinical classification defined by General Office of National Health Committee of China (General Office of National Health Committee 2020). Fifteen (11.5%) of those patients died during hospitalization (Table 1).
-
The majority of the patients had a normal white blood cell count (88/131, 67.2%) and normal procalcitonin (123/128, 96.1%). More than half of the patients had a reduced lymphocyte count (83/131, 63.4%), and increased indicators of inflammation, including ESR (120/127, 94.5%), C-reactive protein (107/128, 83.6%), interleukin 6 (49/97, 50.5%), LDH (85/128, 66.4%) and ferritin (86/119, 72.3%). Some patients showed abnormal coagulation function index, including increased fibrinogen (92/124, 74.2%) and increased D-Dimer (20/123, 16.3%) (Table 2).
Parameter White blood cell count, × 109/L 6.02 ± 3.30 < 3.5 25/131 (19.1%) 3.5 ~ 9.5 88/131 (67.2%) > 9.5 18/131 (13.7%) Neutrophil count, × 109 /L 4.66 ± 3.38 Lymphocyte count, × 109 /L 1.00 ± 0.52 < 1.1 83/131 (63.4%) ≥ 1.1 48/131 (36.6%) C-reactive protein, mg/L < 5 21/128 (16.4%) ≥ 5 107/128 (83.6%) Procalcitonin, ng/mL < 0.5 123/128 (96.1%) ≥ 0.5 5/128 (3.9%) ESR, mm/h 49.82 ± 5.06 < 15 7/127 (5.5%) ≥ 15 120/127 (94.5%) Interleukin6, pg/mL 8.10 ± 5.80 < 7 48/97 (49.5%) ≥ 7 49/97 (50.5%) Ferritin, ng/mL < 274.66 33/119 (27.7%) ≥ 274.66 86/119 (72.3%) LDH, mmol/L 326.14 ± 113.74 < 250 43/128 (33.6%) ≥ 250 85/128 (66.4%) FIB, g/L 5.26 ± 1.91 < 2 3/124 (2.4%) 2 ~ 4 29/124 (23.4%) ≥ 4 92/124 (74.2%) D-Dimer, mg/L < 1.5 103/123 (83.7%) ≥ 1.5 20/123 (16.3%) Continuous data are expressed as mean ± SD. Categorical data are presented as n/N (%), where N is the total number of patients with available data. Table 2. Laboratory parameters.
-
All patients had been chest CT scanned at outpatients department or at other hospitals before admission. All of them were reported with lung infection and, most likely, the viral pneumonia. 124 cases were re-conducted chest CT scan during hospitalization after 15 (± 5.4) days from onset. All chest CT images showed abnormalities, ground glass opacity and infiltrates shadows or consolidation. The majority of the patients presented bilateral, multifocal lung lesions, with peripheral distribution. Pleural effusion were uncommon imaging findings in those patients.
-
The sensitivities of the IgG and IgM ELISA detection in serum samples obtained from patients at different periods after disease onset are shown in Table 3. The overall sensitivities of IgG ELISA (92.5%) were significantly higher than that of IgM ELISA (70.8%) (P < 0.001). In addition, the sensitivity of IgG ELISA in different periods after disease onset (5–10, 11–20 and 31–40 days) were generally higher than that of IgM ELISA, except for the equivalent from 31 to 40 days (P > 0.05) (Table 3). The mean OD450 values of IgM and IgG for 226 serum samples obtained from the 131 confirmed COVID-19 cases were 0.391 and 1.565, with standard deviations of 0.496 and 0.722 respectively (Table 3). For IgG, the mean OD450 values significantly increased to 1.683 during 11 to 20 days after onset, and then maintained relatively high (Table 3). For IgM, however, the OD450 values reached the peak of 0.435 during 21 to 30 days after onset and fell back to 0.187 during 31 to 40 days after onset (Table 3). The sensitivity of IgM increased if the samples were re-detected (Table 4).
Days after onset Number of samples Number of positive for IgM by ELISA Number of positive for IgG by ELISA ELISA OD ratio of IgM ELISA OD ratio of IgG 5 ~ 10 34 13 (38.2%) 22 (64.7%)* 0.202 ± 0.273 0.905 ± 0.808 11 ~ 20 151 115 (76.2%) 147 (97.4%)* 0.431 ± 0.534 1.683 ± 0.653# 21 ~ 30 35 28 (80.0%) 35 (100%)* 0.435 ± 0.493 1.686 ± 0.542# 31 ~ 40 6 4 (66.7%) 5 (83.3%) 0.187 ± 0.103 1.621 ± 0.932# 5 ~ 40 226 160 (70.8%) 209 (92.5%)* 0.391 ± 0.496 1.565 ± 0.722# *P < 0.05 versus IgM in the same period.
#P < 0.05 versus 5 to 10 days.Table 3. Differential sensitivity of ELISA for detection of IgM and IgG in different periods after disease onset.
Times of detection Number of patients Number of positive for IgM by ELISA Number of positive for IgG by ELISA 1 36 26 (72.2%) 35 (97.2%) 2 95 87 (91.6%)* 94 (98.9%) Total 131 113 (86.3%) 129 (98.5%) *P < 0.05 versus once. Table 4. Differential sensitivity of ELISA for detection of IgM and IgG with different times in COVID-19 patients.
-
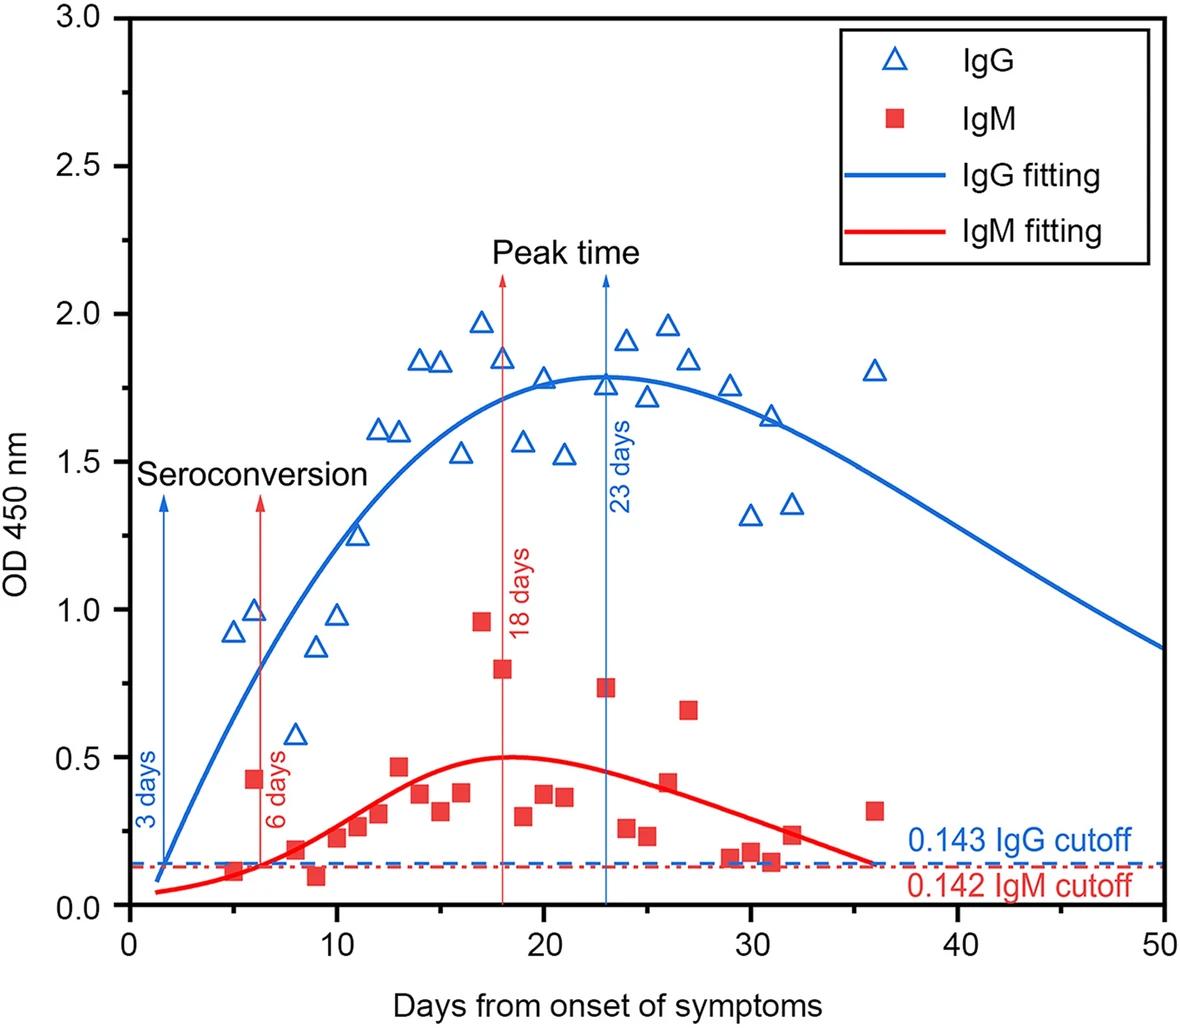
Among the 131 confirmed cases, 16 cases were in hospital varying 30 to 60 days after onset of illness, whereas 109 patients were discharged within 30 days after onset. 115 patients survived. The median OD450 results from the available serum specimens of all patients were calculated and were plotted as a function of the days from onset of symptoms (Fig. 1). For IgM, the median OD450 rose above the baseline level at day 6 (seroconversion time), peaked at around day 18, and fell to below the baseline level at about day 36. The seroconversion time of IgG was 3 days. The IgG antibody level peaked at around 23 days, and then maintained relatively high (Fig. 1). IgG antibodies in 3 of 95 patients converted from positive to negative after 5 days (detected twice) (Table 5). Two of these three patients had only mild symptom but the third one presented critical situation and later died in hospital.

Figure 1. Longitudinal profile of IgG and IgM antibodies in 131 patients with COVID-19.
Negative to positive Positive to negative Positive twice Negative twice Number (%) of IgM change 30 (31.6%) 10 (10.5%) 47 (49.5%) 8 (8.4%) Number (%) of IgG change 11 (11.6%) 3 (3.2%) 80 (84.1%) 1 (1.1%) Table 5. Dynamic changes of IgM and IgG in COVID-19 patients (n = 95).
Clinical Characteristics
Laboratory Parameters
CT Image Acquisition
Sensitivity of IgM and IgG ELISA Detection in COVID-19 Patients
Dynamic Changes of IgG and IgM Antibodies for COVID-19 Patients
-
Being able to detect the virus promptly and accurately is crucial in curbing the wide spread of infectious diseases, such as the COVID-19 which spread rapidly and killed a lot of people. Generally, the testing methods are based on the epidemiological risk, clinical features, imaging features and laboratory assays. We reported the retrospective sensitivity comparison of IgM and IgG ELISA detection for 131 confirmed cases of COVID-19 at early stage of outbreak in Wuhan. Meanwhile, the clinical characteristics of abovementioned patients were collected and analyzed. Over half of the patients in our study were male and had a history of exposure to the Huanan Seafood Market. The clinical features of fever, dry cough and dyspnea, which were in general the typical respiratory symptom and similar to SARS-CoV and MERS-CoV infections (Assiri et al. 2013), were respectively observed among 94.7%, 73.3% and 38.2% of the total 131 confirmed cases. However, a few patients presented common atypical onset symptoms, including headache, dizziness, nausea, vomit or diarrhea, which were unique and might lead to misdiagnosis. Moreover, since COVID-19 patients may harbor the virus in the intestine at the early or late stage of infection (Zhang et al. 2020), the suspected cases who mainly presented intestinal signs and symptoms were suggested to have a test with SARS-CoV-2 nucleic acid from faecal samples or anal swabs.
Among the total investigated cases, 55.5% of them suffered from organ function damage, and 63.4% of them showed common symptoms on reduced lymphocyte count and increased indicators of inflammation. These are all indicators of critical illness and poor prognosis (Yang et al. 2020; Zhao et al. 2020). The majority of the patients had a normal white blood cell count (67.2% of patients) and normal procalcitonin (92.1% of patients), which was consistent with rare bacterial infection. Unfortunately, 16 cases (12%) developed severe illness and eventually died.
The sensitivity of IgG was significantly higher than that of IgM in this work, which is consistent with the results from recent reports (Long et al. 2020; Qu et al. 2020; Xiang et al. 2020; Zhao et al. 2020), where IgG tests performed 100% of sensitivity. The seroconversion of IgG against SARS-CoV-2 was earlier than that of IgM (3 days vs 6 days after onset), then maintained at high level longer than IgM. IgG maintained positive longer than 50 days, but IgM converted to negative around 36 days after onset. This observation is significantly different with dynamic changes of antibodies against SARS-CoV reported previously (Chan et al. 2007).
As we observed, IgG antibody could generally keep positive for a long period. While a surprising observation is that 3 cases converted from positive to negative after 5 days with twice tests. It is still unclear whether the COVID-19 patients would acquire permanent immunity to this disease after certain time. Further studies are needed to confirm this.
In conclusion, our findings suggested that detection of antibodies showed tremendous value in helping diagnosis of COVID-19 infection. IgG could be a sensitive indicator for retrospective diagnosis and contact tracing, and IgM could be an indicator of early COVID-19.
-
We acknowledge Dr. Rui Shu from Linköping University, Sweden for deep discussion.
-
HS and SW designed the study and wrote the paper. SR, YW, JZ, YW and RL collected the data. YY, HL, SP, and YO analyzed the data. SY, PZ and YS checked and finalized the manuscript. All authors read and approved the final manuscript to be published.
-
The authors declare that they have no conflict of interest.
-
This study was approved by the Ethics Commission of Jin-Yin-Tan Hospital (KY-2020-47.01). Written informed consent was waived by the Ethics Commission of the designated hospital according to the policy for public health outbreak investigation of emerging infectious diseases.


 DownLoad: