


HTML
-
The ongoing coronavirus disease (COVID-19) pandemic caused by severe acute respiratory syndrome coronavirus 2 (SARS-CoV-2) remains a substantial threat to public health. Most COVID-19 patients recover with complete SARS-CoV-2 clearance and are released from quarantine (Wang et al. 2020). A previous study showed that the median and the longest duration of SARS-CoV-2 clearance were 20 days and 37 days from illness onset, respectively (Zhou et al. 2020), with a duration over 30 days categorized as prolonged viral shedding (Jin et al. 2020). However, we observed a cluster of COVID-19 patients with long-term SARS-CoV-2 infection extending to 50 days from onset. Although clinically cured with an absence of related symptoms and massively improved chest radiology, these patients persistently tested positive for SARS-CoV-2 nucleic acids in upper respiratory samples, and were thus subjected to quarantine. It is unclear why viruses could not be fully cleared in these individuals.
The host immune system is involved in the pathogenesis of COVID-19. SARS-CoV-2 infection triggers T and B cell-mediated immune responses, which are capable of eliminating the virus and resolving the infection (Zhang et al. 2020). CD8+ T cells and natural killer (NK) cells are important for directly attacking and killing virus-infected cells. SARS-CoV-2-specific neutralizing antibodies produced by B cells can neutralize viruses, thereby blocking SARS-CoV-2 infection, whereas CD4+ T cells are crucial to prime both CD8+ T cells and B cells (Ni et al. 2020; Tay et al. 2020; Zhang et al. 2020). However, in some COVID-19 patients, a dysfunctional immune response occurs, which can cause severe lung and even systemic pathology (Tay et al. 2020). Lymphocytopenia is a prominent clinical feature of COVID-19 patients, where CD4+ and CD8+ T cells are suppressed, thereby disabling viral clearance, particularly in severe and critical cases (Ni et al. 2020). Moreover, Chen et al. demonstrated that B cells and NK cells were less suppressed in infected patients (Chen et al. 2020). Nevertheless, it remains unknown whether COVID-19 patients with long-term SARS-CoV-2 infection had a dysfunctional immune response, which delayed viral clearance.
The presence of SARS-CoV-2 nucleic acids in the respiratory tract indicates an infective COVID-19 patient who needs quarantine. It has been shown that virus transmission begins 2–3 days prior to the appearance of the first symptoms and peaks at 0.7 days before symptom onset, pointing to the markedly enhanced virulence (He et al. 2020). Yet, in asymptomatic individuals carrying SARS-CoV-2, transmissibility may be weak and last for as long as 21 days (Gao et al. 2020; Hu et al. 2020). However, it remains unknown if virulence is altered in long-term COVID-19 patients and whether they are contagious or not.
In this study, we analysed host immunity, cultured and isolated SARS-CoV-2, and performed genome sequencing in COVID-19 patients with long-term infection. We aimed to investigate the reasons of viral clearance delay and infectivity and to ultimately facilitate improved management of COVID-19 patients.
-
In this retrospective, single-centre study, we recruited 22 laboratory-confirmed COVID-19 patients with long-term existence of SARS-CoV-2 nucleic acid infection. They were quarantined at Tongji Hospital, Tongji Medical College of Huazhong University of Science and Technology, in Wuhan, China. Demographic data, comorbidities, symptoms, disease severity, imaging examinations, and other laboratory findings were collected from electronic medical records using data collection forms. Another physician on our team reviewed the data independently.
-
Peripheral blood was collected and heparinized. The absolute and percentage numbers of CD4+ and CD8+ T cells, B cells, and NK cells were determined by using TruCOUNT tubes and BD Multitest 6-color TBNK Reagent Kit (BD Biosciences) according to the manufacturer's instructions as previously described (Mazzoni et al. 2020). In brief, 50 µL of whole blood was labelled with 6-color TBNK antibody cocktail for 15 min in room temperature, followed by adding 450 µL of FACS Lysing Solution. Samples were then analysed with a FACSCanto flow cytometer using FACSCanto clinical software (BD Biosciences). Cells with high CD45 expression and low side scatter were gated as lymphocytes. TruCOUNT beads were gated based on side scatter and fluorescence intensity. CD3+ cells in lymphocyte gate were defined as total T cells. CD4+ T cells or CD8+ T cells, B cells, and NK cells were defined as CD4+ CD8- or CD8+ CD4- cells in CD3+ cells, CD19+, and CD16+ CD56+ cells in CD3- cells, respectively.
PMA/ionomycin-stimulated lymphocyte functionality assay was performed as described preciously (Zhang et al. 2019; Mazzoni et al. 2020; Zheng et al. 2020). We diluted 100 μL of whole blood with 400 μL of IMDM medium and stimulated with Leukocyte Activation Cocktail for 4 h (containing PMA, ionomycin and brefeldin A, BD GolgiPlug). The cells were labelled with monoclonal antibodies (anti-CD3, anti-CD4, anti-CD8, and anti-CD56), fixed and permeabilized, stained with intracellular anti-IFN-γ (catalog 554702) antibody, and analysed by flow cytometry.
-
Nasopharyngeal swab specimens were collected. RNA was extracted with QIAamp vRNA Minikit (Qiagen, Hilden, Germany), and SARS-CoV-2-specific viral RNA was detected with the Novel Coronavirus 2019-nCoV Nucleic Acid Detection Kit (Real Time RT-PCR) (GeneDx, Shanghai, China), which targeted the N and ORF1ab genes, according to the manufacturer's instructions. A cycle threshold (Ct) value of 40 was used as the cut-off value for positive tests.
The amplification procedure was set at 94℃ for 2 min, 40 cycles of 94℃ for 15 s, annealing for 30 s and 68℃ for 1 min, followed by 68℃ for 5 min. The annealing temperatures were 55℃ for the whole S gene both for the first and second round. The final amplification products of S gene were sequenced with nested PCR. Sequence data discovered in this study have been deposited in GISAID (https://www.gisaid.org/) with the accession number EPI_ISL_470802.
Nested PCR was carried out using 2× TransStart FastPFU Fly PCR SuperMix of the whole S gene. Primer pairs, CoV-F1 (5′-GGTTGGGATTATCCTAAATGTGA-3′) and CoV-R (5′-GCATCGTCAGAGAGTATCATCAT-3′), and CoV-F2 (5′-GATTATCCTAAATGTGATAGAGC-3′) and CoV-R were used, respectively.
The amplification procedure was set at 94℃ for 2 min, 40 cycles of 94℃ for 15 s, annealing for 30 s and 68℃ for 1 min, followed by 72℃ for 5 min.
-
For measurement of IgM and IgG against SARS-CoV-2, plasma samples were collected from COVID-19 patients when the final positive SARS-CoV-2 test was present. IgM and IgG antibodies were quantified using the chemiluminescent microparticle immunoassay (CMIA) technique, according to the manufacturer guide (2019-nCoV antibody detection kit, InnoDx, Xiamen, China). Briefly, the sample, SARS-CoV-2 antigen-coated paramagnetic microparticles, and assay dilutes were combined and incubated, during which the IgM and IgG antibodies bound to the SARS-CoV-2 antigen-coated microparticles. The mixture was then washed, and anti-human IgM or IgG acridinium-labelled conjugate was added to create a reaction mixture, followed by incubation. Following a wash cycle, Pre-Trigger and Trigger solutions were added. The chemiluminescent reaction was then measured as a relative light unit (RLU) detected by system optics, which was in a direct relationship with the amount of IgM and IgG antibodies against SARS-CoV-2 in the sample.
For the virus neutralization test, plasma samples were heat-inactivated by incubation at 56 ℃ for 30 min. Each plasma sample was serially diluted with Dulbecco's modified Eagle medium (DMEM) by twofold or threefold according to the OD value and sample quality mixed with an equal volume of diluted virus. The mixture was incubated at 37 ℃ for 1 h. Vero E6 (ATCC CRL-1586) cells in 24-well plates were inoculated with the sera-virus mixture at 37 ℃; 1 h later, the mixture was replaced with DMEM containing 2.5% FBS and 0.8% carboxymethylcellulose. The plates were fixed with 8% paraformaldehyde and stained with 0.5% crystal violet 3 days later. All samples were tested in duplicate, and neutralization titres were defined as the plasma dilution resulting in a plaque reduction of at least 50%.
-
Fresh nasopharyngeal swab specimens collected from laboratory-confirmed COVID-19 patients in viral transport media were used as the inoculum for virus isolation. Briefly, Vero E6 cells were cultured for 24 h in a 24-well plate format before inoculation. The culture medium was the minimal essential medium containing 2% foetal bovine serum, 100 units/mL penicillin, and 100 μg/mL streptomycin. The swab specimens were centrifuged at 5000 rpm for 10 min at 4 ℃ in a benchtop centrifuge, and the supernatant was separated and inoculated on Vero E6 cells in alternative wells of the 24-well plate. After two hours of incubation for adsorption in a 37 ℃ incubator containing 5% CO2, fresh virus growth medium was added to a final volume of 1 mL and then incubated in a 37 ℃ incubator containing 5% CO2 for six days. The presence of cytopathic effect (CPE) was monitored daily.
-
The virus genome was sequenced by two different approaches, (1) untargeted metatranscriptome sequencing on the BGI MGISEQ-2000 sequencing platforms, and (2) Sanger sequencing of the spike region of the virus genome. For the metatranscriptome approach, total RNA was extracted from nasopharyngeal swab specimens, followed by synthesis of double-strand cDNA. cDNA were then subjected to concentration and quality measurement with the Agilent Bioanalyzer 2100 and Qubit. DNA nanoball (DNB)-based libraries were constructed following the manufacturer's protocol. The libraries were then sequenced on the MGISEQ-2000 platform with a sequencing length of paired-end 150 bp. For the multiplex PCR approach, we designed PCR primers that fully cover the whole virus genome to perform the amplicon sequencing. The PCR products were collected and quantified, followed by MGISEQ-2000 DNB-based library preparation and sequencing. The samples with the highest Ct value were reverse transcribed with random primers, using the PrimeScript RT reagent Kit (TaKaRa, Dalian, China). Nested PCR was carried out by using 2× TransStart FastPFU Fly PCR SuperMix to obtain the whole spike gene.
-
Sequencing adaptors were removed from the raw reads, and reads were filtered for quality using Trimmomatic. The clean reads were then mapped to the host genome (NCBI assembly accession GCF_000181335.3) using Bowtie2, and only reads that could not be mapped to the monkey genome were retained for mapping against the virus genome (NCBI MN908947.3). Based on the virus genome mapping results, reference-based assembly of the mapping reads was performed. Consensus sequences were generated using Samtools 1.9 and Bcftools 1.10.2.
Routine sequence management and analysis were carried out using DNAStar. Sequence alignment of SARS-CoV-2 with reference sequences was carried out with MEGA software (version 6.0). The codon alignments of the full-length S and RdRp gene sequences were converted from the corresponding protein alignments by PAL2NAL (v.14); the protein alignments were created by Clustal Omega (v.1.2.4) using default parameters. Maximum likelihood phylogenetic trees were generated using RAxML (v.0.9.0) with the GTR + G substitution model and 1000 bootstrap replicates. The sequences obtained in this study were deposited in GISAID (https://www.gisaid.org/).
-
Analyses was performed using Graph Pad Prism (GraphPad Software, San Diego, CA, USA). All continuous variable data were tested for normality using a Shapiro–Wilk test. Continuous data was presented as mean ± SD or median (IQR) in case of skewed data. Categorical outcomes were given as absolute and relative frequencies (%). Pearson's correlation coefficients were calculated. P < 0.05 indicates statistical significance.
Study Design and Participants
Peripheral Lymphocyte Count and Functionality Assessment
Nucleic Acid Extraction and RT-PCR for SARS-CoV-2
Detection of SARS-CoV-2 Specific Antibody and Virus Neutralization Test (VNT)
Virus Isolation
Virus Genome Sequencing
Sequencing Data Analysis
Statistical Analysis
-
The mean age of the cohort was 59.83 years, and 54.55% were male. Non-severe patients represented 45.45% of the total, and the rest (54.55%) were severe, in accordance with the Diagnosis and Treatment Program of COVID-19 (7th edition). Hypertension was the leading pre-existing disease (45.45%), followed by diabetes (40.91%), chronic respiratory diseases (13.64%), chronic renal disease (13.64%), coronary heart disease (9.09%), cancer (9.09%) and chronic hepatitis (4.55%). All patients (100%) were clinically cured, presenting no symptoms and significantly improved chest computed tomography scan. Only one patient exhibited mild somnolence (Table 1).
Characteristics Age-years, mean ± SD 59.83 ± 12.94 Gender—n/N (%) Male 12/22 (54.55) Female 10/22 (45.45) Underlying diseases—n/N (%) Hypertension 10/22 (45.45) Diabetes 9/22 (40.91) Chronic respiratory diseases 3/22 (13.64) Chronic renal disease 3/22 (13.64) Coronary heart disease 2/22 (9.09) Cancer 2/22 (9.09) Chronic hepatitis 1/22 (4.55) Disease Severity of COVID-19—n/N (%) Non-severe 12 (54.55) Severe 10 (45.45) Initial symptoms—n/N (%) Cough 20/22 (90.90) Fever 18/22 (81.82) Fatigue 12/22 (54.55) Dyspnea 8/22 (36.36) Chest tightness 7/22 (31.82) Myalgia 4/22 (18.18) Diarrhoea 2/22 (9.09) Nausea or vomit 1/22 (4.55) Clinical outcomes†—n/N (%) Symptoms alleviated 22 (100) Presented symptoms 1 (4.55) Chest computed tomography improved or almost normal 22/22 (100.00) Freedom of oxygen treatment 22/22 (100.00) Highest body temperature within 72 h prior to sampling (℃) 36.64 ± 0.38 Data presented as n(n/N %) or otherwise indicated, where N is the total patients.
†as of studied time.
SD, standard deviation.Table 1. Demographics and clinical characteristics of studied patients.
-
All 22 of the studied patients were visibly positive for SARS-CoV-2 nucleic acids in nasopharyngeal swab specimens 50 days after initial symptoms. The final positive result was observed and demonstrated in a timeframe of 50 to 120 days post initial symptoms (Fig. 1A). The positive rate gradually declined to 86.36% at 70 days, 36.36% at 80 days, and 4.55% at 100 days post initial symptoms. Such decline became significant after 75 days post initial symptoms (positive rate 59.09%), and dropped to 0% after 110 days. In turn, patients were consistently converted to negative for SARS-CoV-2 nucleic acid, and the conversions were mainly centralized between 70 and 90 days, with the latest negative result pronounced 115 days post initial symptoms (Fig. 1B).
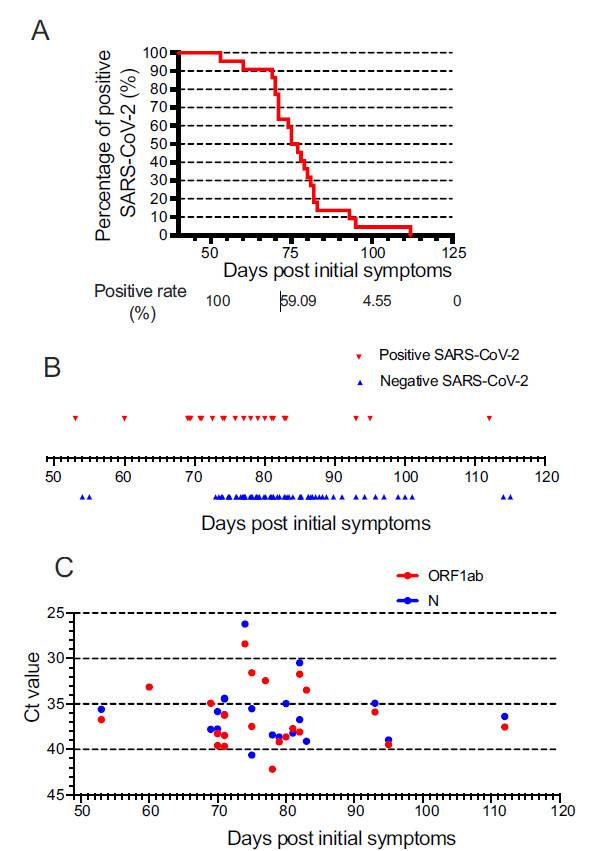
Figure 1. Evolutionary course, conversion, and viral load of long-term SARS-CoV-2 patients. Positive rate of latest SARS-CoV-2 (A), negative conversion (B), and Ct value of ORF1ab and N for latest positive SARS-CoV-2 (C) in studied 22 patients from 50 to 120 days post initial symptoms.
Meanwhile, we analysed SARS-CoV-2 load in nasopharyngeal swab specimens by RT-PCR. Ct values were used as a relative standard for SARS-CoV-2 RNA expression, with lower Ct values corresponding to higher viral copy numbers. For each specimen, SARS-CoV-2 was considered positive if the Ct value of either the ORF1ab gene or the N gene was less than 40. The Ct values of the latest positive SARS-CoV-2, categorized to ORF1ab (Ct value 36.40 ± 3.36) and N (Ct value 36.06 ± 3.23) were demonstrated in Fig. 1C, in an observational period of 50–120 days after symptom onset. Eighteen patients (81.8%) were double positive for both genes, while single positive either for the ORF1ab gene or the N gene were 3 (13.6%) or 1 (4.60%), respectively.
-
To explore the immune response in COVID-19 patients with long-term SARS-CoV-2 infection, the peripheral blood subgroup of lymphocytes and IFN-γ-secreting T cells were assessed at the time of latest positive SARS-CoV-2 tests. IFN-γ producing capability can be used as a marker of lymphocyte function. The counts of total T lymphocytes, total B lymphocytes (tBL), CD4+ T cells, CD8+ T cells, and NK cells were 1184 ± 297.2/μL, 170.6 ± 75.29/μL, 709.3 ± 237.7/μL, 413.9 ± 192.8/μL, and 402.7 ± 537.7/μL, respectively (Fig. 2A). Functionality assessment disclosed that the ratios of IFN-γ-secreting cells to total CD4+ and CD8+ T cells were 24.68% ± 9.60% and 66.41% ± 14.87%, respectively, which were generally in the normal range (14.54%–36.96%; 34.93%–87.95%). IFN-γ-secreting NK cells were 58.03% ± 11.78%, lower than the given range (61.2%–92.65%) (Fig. 2B).
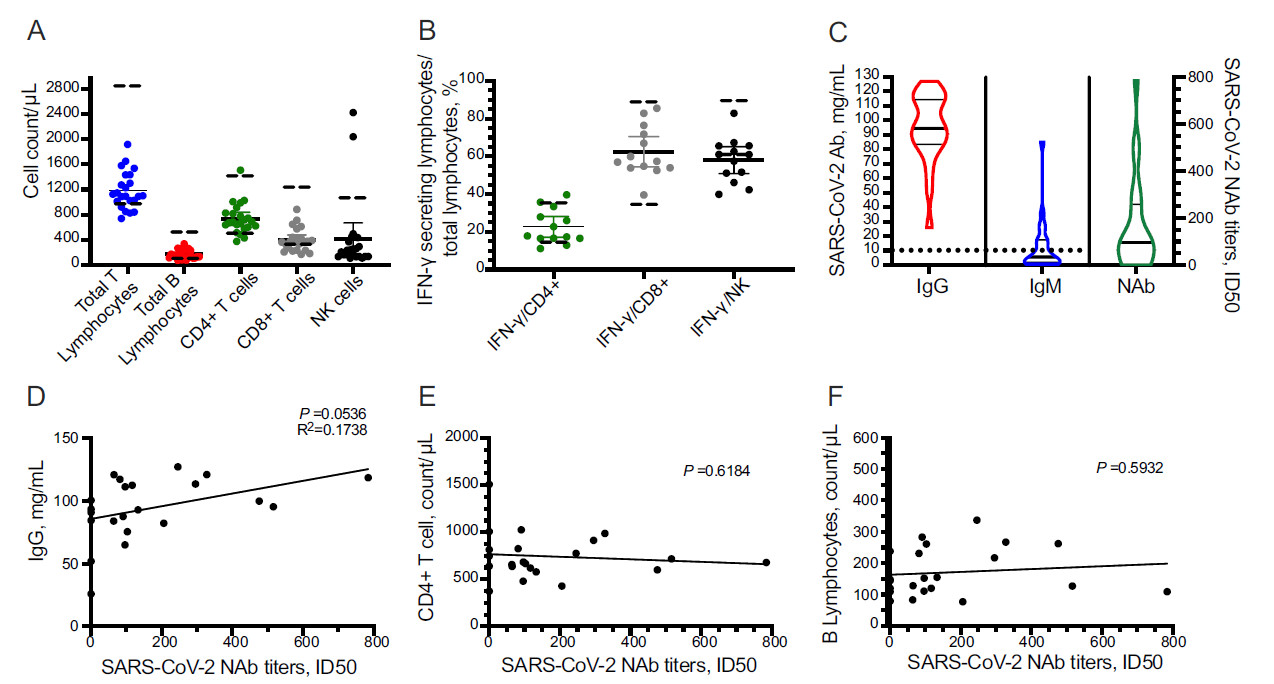
Figure 2. Long-standing SARS-CoV-2-induced host immune response. Peripheral blood lymphocyte counts (A). Lymphocyte functionality assessed by IFN-γ produced CD4+/CD8+ T cells or NK cells (B). Detection of SARS-CoV-2-specific IgM, IgG, and neutralizing antibody (C). Correlation of SARS-CoV-2-neutralizing activity with IgG (D), B lymphocytes (E), and CD4+ T cell (F), respectively. Dashed lines represent the normal range of giving items.
Next, we detected SARS-CoV-2-specific antibodies and their SARS-CoV-2 neutralizing activity, which was evaluated by neutralization antibody titres. Plasma samples were collected upon the time of latest positive SARS-CoV-2 test. All patients generated moderate IgG titres (94.41, 83.46–114.40 mg/mL) against SARS-CoV-2. Also, SARS-CoV-2-specific IgM (5.57, 1.75–17.40 mg/mL) was detectable but deemed negative according to the user guide of the test (< 10 mg/mL) in the same time point (Fig. 2C). The mean value of SARS-CoV-2 neutralizing activity of the 22 studied patients was 157.2, of which 5 exhibited no neutralization antibody (NAb) (Fig. 2C). The production of SARS-CoV-2-specific NAb was positively correlated to the titres of IgG (P = 0.054, R2 = 0.1738, Fig. 2D), but had no correlation to the B cell (P = 0.5932) and CD4+ T cell (P = 0.6184) counts, as shown in Fig. 2E and 2F.
-
We also analysed whether the SARS-CoV-2 load was correlated to the immune response (Fig. 3). The expression of the N gene was found to be positively correlated to the NK cells (P = 0.0023, R2 = 0.4105, Fig. 3E), but not for the other lymphocyte subsets. Furthermore, the OFR1ab gene was not correlated to any lymphocyte subsets, neither for cell count, nor for functionality (Fig. 3A–3H).

Figure 3. Correlation of long existing SARS-CoV-2 load and immune reaction. Correlation of Ct value of ORF1ab or N and SARS-CoV-2 neutralizing antibody (A), B lymphocytes (B), CD4+ T cell (C), CD8+ T cell (D), NK cell (E), IFN-γ produced CD4+/CD8+ T cell (F, G), or NK cell (H).
-
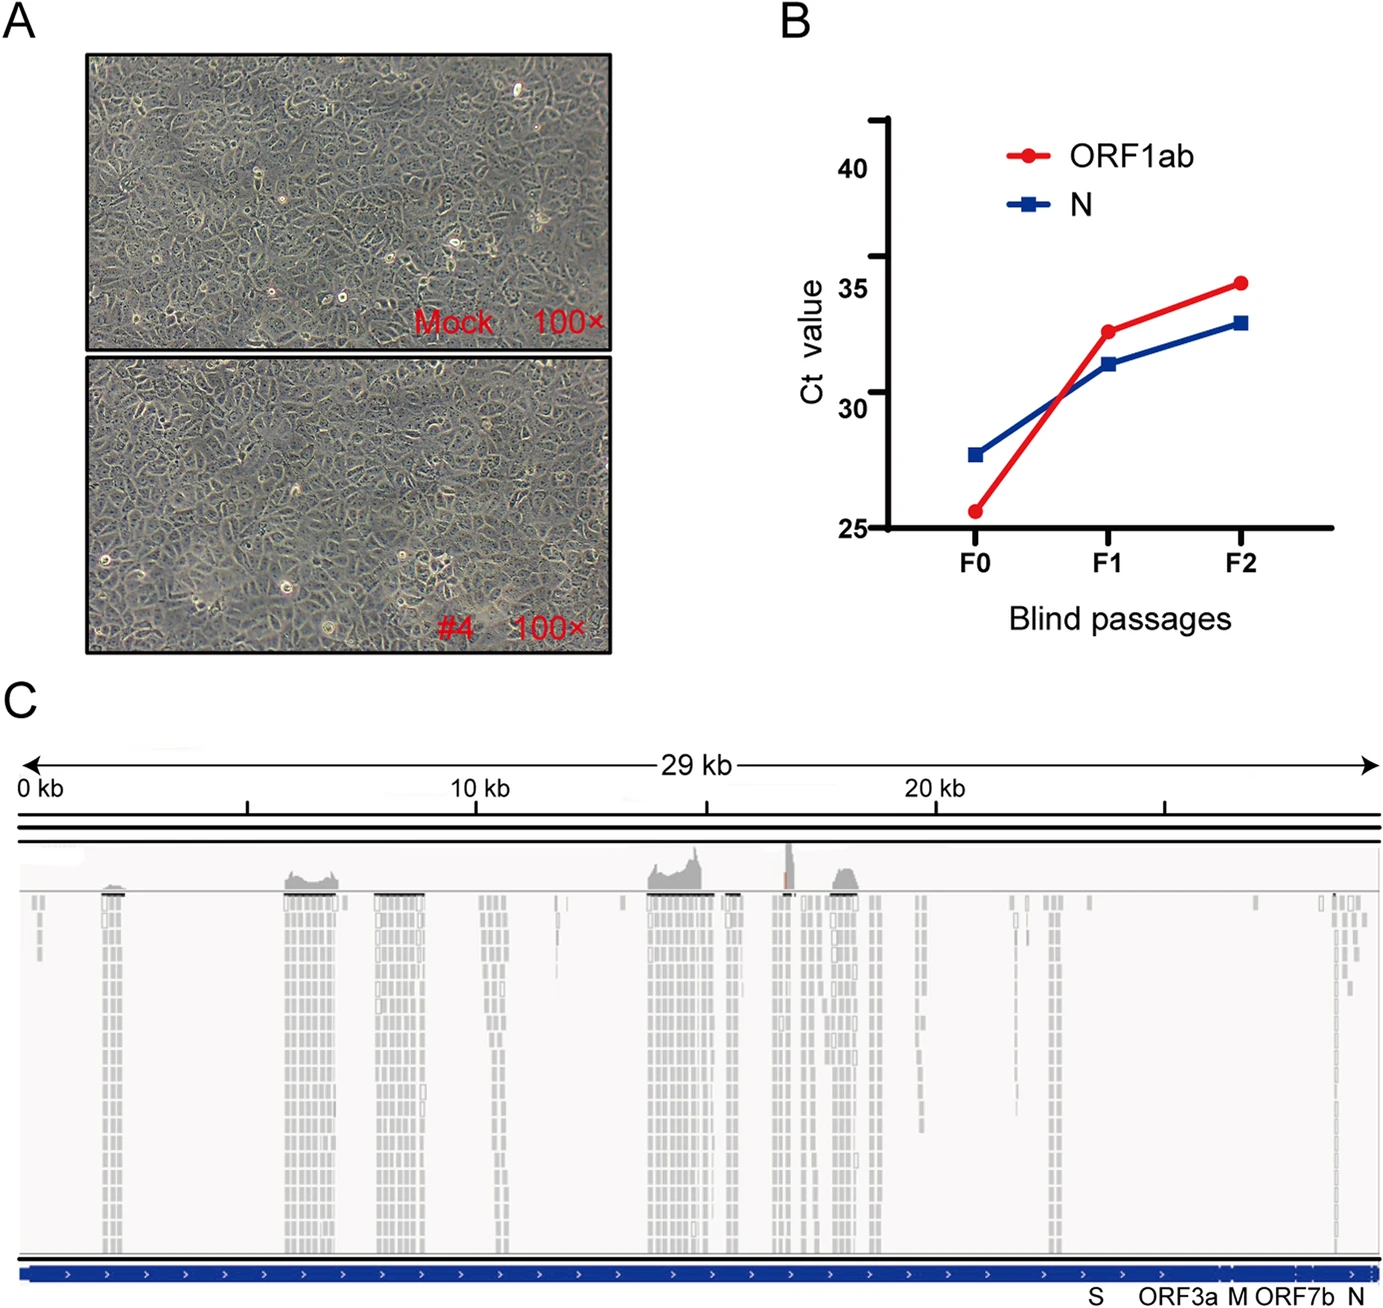
To investigate whether SARS-CoV-2 virulence had altered, virus isolation was performed with Vero E6 cells from nasopharyngeal swab specimens 50 days after initial symptoms in COVID-19 patients. We were not able to isolate SARS-CoV-2 and did not observe a cytopathic effect (Fig. 4A). However, only one sample from one COVID-19 patient (Patient #4) was positive for SARS-CoV-2 nucleic acid in cell supernatants from two passages, with Ct values gradually increasing during cell passages (Fig. 4B). However, further passages of the virus in Vero E6 cells were unsuccessful.
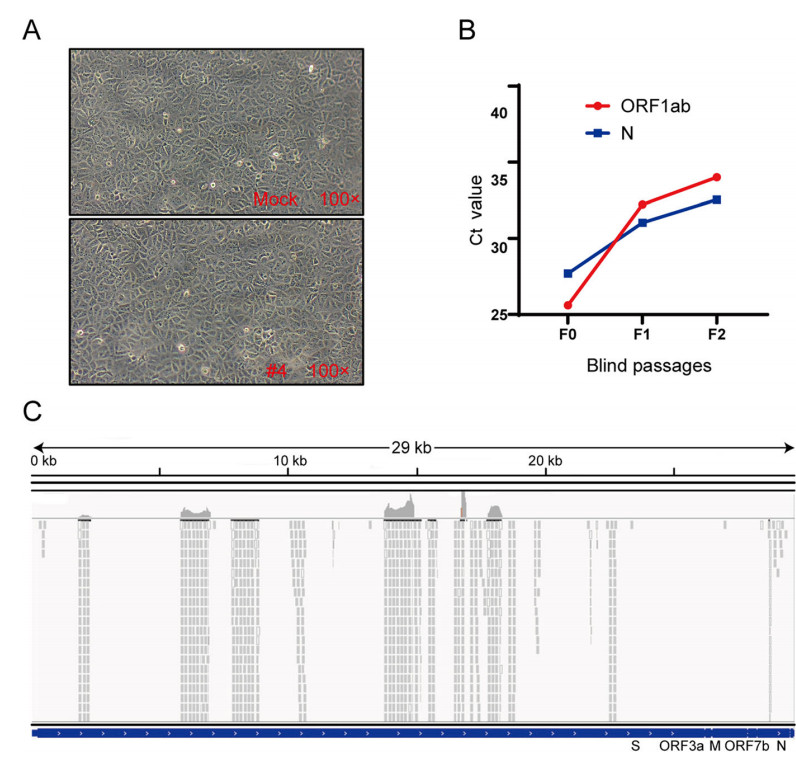
Figure 4. The result of virus isolation and sequence. A Cytopathic effect of SARS-CoV-2-infected cells. Vero E6 cells were inoculated with sample, and the cytopathic effect was not observed 72 h post-infection. B The Ct values of the sample from patient #4. Vero E6 cells were inoculated with the sample for six days, and the supernatant was subjected to real-time RT-PCR detection with CFDA approved testing kits. The replication of the virus was indicated as Ct values. C NGS raw reads of patient #4 mapped to the SARS-CoV-2 sequence. Reads coverage and sequencing depth of the metatranscriptome sequencing.
Metatranscriptome sequencing was performed on the abovementioned positive sample to analyse the virus genome. Amplicon sequencing of the multiplex PCR products generated extra 65, 847, 006 reads, 69, 506 of which were SARS-CoV-2 reads. Those SARS-CoV-2 reads together covered 11, 160 nucleotides (37.5% of the genome) of the virus genome (Fig. 4C). Eleven consensus sequences longer than 200 bp were obtained, with a total length of 7032 nt (23.6% of the genome) and length ranging from 225 nt to 1500 nt. No variant in the covered virus genome region was observed. One of the consensus sequences had an overlap of 354 nucleotides with the receptor-binging domain of the spike protein coding sequence, showing 100% identity with the reference of Wuhan-Hu-1. Next, nested-PCR assays targeting the spike gene of SARS-CoV-2 were also performed on this sample, and the amplified fragments were sequenced. Full-genome sequences of the S gene, named hCov-19/Wuhan/Tongji-04-2/2020, were submitted to GISAID and are available under accession numbers EPI_ISL_4470802|2020-04-20. To better understand the evolutionary relationships of hCov-19/Wuhan/Tongji-04-2/2020 in detail, phylogenetic analyses were conducted (Supplementary Figure S1). The S gene of hCoV-19/Wuhan/Tongji-04-2/2020 were more closely related to EPI_ISL_480345 and EPI_ISL_478457, while EPI_ISL_434534 was more distant (Supplementary Figure S1). Compared to the first released genome (Wuhan-Hu-1), a total of only 3 synonymous variants were identified in spike protein-coding regions.
Demographics and Clinical Characteristics
Evolutionary Course, Conversion, and Viral Load in Long-Term SARS-CoV-2 Infection
Long-Standing SARS-CoV-2-Induced Host Immune Response
Correlation of SARS-CoV-2 Load and Immune Reaction
SARS-CoV-2 Isolation and Sequencing
-
In this study, we analysed the immunological parameters, isolated viruses, and performed whole-genome sequencing of SARS-CoV-2 in long-term COVID-19 patients. We found that although the numbers of lymphocytes were normal, both IFN-γ-expressing NK cells and the titres of SARS-CoV-2-specific neutralizing antibodies were at a low level. The SARS-CoV-2 was not successfully isolated nor the cytopathic effects were observed. The analysis of the virus genome from only one COVID-19 patient revealed that three synonymous variants exist in the S gene-coding regions of SARS-CoV-2, compared to the first released genome.
Twenty-two COVID-19 patients enrolled in this study showed long-term presence of SARS-CoV-2. They had shown clinical recovery with absence of related symptoms, massively improved or almost normal chest radiology, and did not need treatment anymore (Table 1). However, they displayed persistently detectable SARS-CoV-2 in the upper respiratory tract for more than 50 days PIS. The post-symptomatic median and the longest duration of detectable SARS-CoV-2 were 76 days and 112 days, respectively (Fig. 1A, 1B), which were much longer than in most recovered patients. Zhou et al. (Zhou et al. 2020) reported that the median and the longest duration of SARS-CoV-2 clearance were 20 days and 37 days from illness onset, respectively. The interplay between host immune response and viruses in COVID-19 patients determines the development of the disease (Tay et al. 2020). It is therefore unclear whether host immunity or virus characteristics delay SARS-CoV-2 clearance in these COVID-19 patients.
In the present study, we first investigated the immune response of COVID-19 patients with long-term existence of SARS-CoV-2. Cytotoxic lymphocytes such as CD8+ T lymphocytes and NK cells are essential for the control of viral infections and affect viral clearance, which can be mediated by direct cytotoxicity or through the release of IFN-γ (Rosen and Golden-Mason 2019; Ni et al. 2020; Padoan et al. 2020). The numbers of NK and CD8+ T cells were decreased markedly, which was associated with exhausted function at the early stage of COVID-19 illness, but were restored after therapy (Padoan et al. 2020). In our study, SARS-CoV-2 load was positively correlated to total NK cells (P = 0.0012, R2 = 0.4155, Fig. 3E), which suggested that viruses may induce the host to recruit more NK cells to eliminate viral infection. However, we found that the mean total number of NK cells was within the normal range, but 40.9% (9/22) COVID-19 patients showed a lower limit of normal value (Fig. 2A), and IFN-γ-expressing NK cells too were at the lower limit of normal value (Fig. 2B). These findings implied that NK cells may contribute to SARS-CoV-2 clearance, and the decrease in IFN-γ-expressing NK cells might delay viral clearance in COVID-19 patients with long-term existence of SARS-CoV-2. This phenomenon also occurs in chronic hepatitis C virus infection, where decreased NK cell level and IFN-γ production favour viral persistence (Tang et al. 2020).
As with any virus, the adaptive immune response plays a critical role in clearing SARS-CoV-2 infections and directly influences patients' clinical outcome. Recently, several studies characterizing adaptive immune responses to SARS-CoV-2 infection have reported that most COVID-19 convalescent individuals have detectable neutralizing antibodies, which correlate with the numbers of virus-specific T cells (Deshpande et al. 2020; Suthar et al. 2020; Thevarajan et al. 2020). Ling Ni and his colleagues demonstrated both B and T cells participate in immune-mediated protection to SARS-CoV-2 infection in recovered patients (Ni et al. 2020). In our study, the total numbers of CD8+ T cells and IFN-γ-expressing CD8+ T cells were normal (Fig. 2A, 2B), and were not correlated to SARS-CoV-2 load (Fig. 3D and 3G). CD4+ T cells are crucial to prime both CD8+ T cells and B cells (Ni et al. 2020; Tay et al. 2020). We found that CD4+ T cells and B cells showed similar results to CD8+ T cells (Figs. 2 and 3). These findings suggested that CD4+ T cells, CD8+ T cells, and B cells might not be dysfunctional in COVID-19 patients with long-term SARS-CoV-2 presence. However, further investigations to identify possible role of host factors in the delay of SARS-CoV-2 clearance are needed.
Next, we investigated whether SARS-CoV-2-specific antibodies produced by B cells contributed to delayed viral clearance in COVID-19 patients with long-term SARS-CoV-2 infection. In COVID-19 patients, IgM antibodies appeared within a week post disease onset, and gradually decreased, whereas IgG antibodies were produced 10 days after infection and lasted for a longer time (Ni et al. 2020). Neutralizing antibodies block SARS-CoV-2 infection, and macrophages recognize neutralized viruses and clear them by phagocytosis (Tay et al. 2020). However, neutralizing antibodies titres varied in recovered COVID-19 patients, ranging from below detection (< 30) to 1936, and virus neutralization deficiency occurred in some patients (Zhang et al. 2020). In our study, plasma SARS-CoV-2-specific IgM was close to normal (Fig. 2C). Although all patients generated plasma SARS-CoV-2-specific IgG at a relatively high level, neutralizing antibodies titres were modest, with 22.72% (5/22) patients not presenting any neutralizing activity (Fig. 2C). The low neutralizing antibodies had no correlation to B cells and CD4+ T cells (Fig. 2E, 2F). Taken together, these findings suggested that SARS-CoV-2-specific antibodies had low or even no virus neutralizing activity in COVID-19 patients with long-term SARS-CoV-2 infection. The reason nevertheless needs further investigation.
To investigate virus characteristics, we isolated viruses from nasopharyngeal swab specimens and performed whole-genome sequencing of SARS-CoV-2 in 22 COVID-19 patients with long-term SARS-CoV-2 infection. We found that the SARS-CoV-2 load was low in nasopharyngeal swab specimens (Fig. 1C). Although only one sample from one COVID-19 patient yielded positive SARS-CoV-2 nucleic acid results in the cell supernatants from two passages (Fig. 4B), SARS-CoV-2 could not be isolated successfully, and the cytopathic effects were not observed (Fig. 4A). Combined with the qRT-PCR results, we speculated that the lack of success was due to too low titres of SARS-CoV-2 in patients to be isolated effectively. Roman Wölfel and colleagues demonstrated that the success of virus isolation depended on viral load: samples that contained < 106 copies per mL (or copies per sample) never yielded an isolate (Wolfel et al. 2020). These findings pointed out the insufficient viral load and weak viral pathogenicity in these patients. Such a phenomenon is identical to that in asymptomatic SARS-CoV-2 carriers (Gao et al. 2020; Hu et al. 2020). The analysis of the virus genome found that three synonymous variants were identified in the spike protein coding regions of SARS-CoV-2, compared to the first released genome (Wuhan-Hu-1) (Supplementary Figure S1 and Fig. 4). The obtained viral genome sequences suggested that the COVID-19 patients with long-term SARS-CoV-2 infection had no relationship with the virus itself.
Our study has a limitation. We failed to observe the dynamic changes in the viral load and the induced immune response, since the patients were referred from different hospitals for centralized quarantine with discontinuity of medical data.
In summary, we found that decreased IFN-γ production by NK cells and the low neutralizing antibody count might favor SARS-CoV-2 long-term existence. However, the viral load was low, and viral pathogenicity was weak in COVID-19 patients with long-term SARS-CoV-2 infection. This study, to some extent, may provide additional concerns when handling patients clinically cured from COVID-19 but bearing long-term existed SARS-CoV-2.
-
This work was support by National Natural Science Foundation of China under Grant (81800095) and Key Scientific and Technological Project of Hubei province (2020FCA004).
-
XW, ZZ, MJ and SX conceptualized the study; XW, KH, HJ., LH, WY, DD, KW, XL and ZZ acquisited and summarized the original data; XW, HJ, KH, ZZ analyzed the data; XW; HJ; ZZ., KH and SX drafted the original manuscript; XW, ZZ, MJ and SX revised and edited the manuscript; XW, ZZ, MJ and SX supervised and managed the project; All authors have read and agreed to the published version of the manuscript.
-
The authors declare no conflict of interest.
-
The ethical committee of Tongji Hospital (file number TJ-IRB20200204) approved this study. All participates gave oral consent.


 DownLoad: