


HTML
-
Dengue is an arthropod-borne viral infection transmitted to humans by the infected female Aedes mosquito causing an acute febrile illness (Simmons and Farrar 2012). There are annual estimates of 390 million infections and more than 3.9 billion individuals at risk of infection worldwide (Bhatt et al. 2013). Globally, dengue is endemic in almost more than 125 countries covering mostly Southeast Asia, the Americas and Western Pacific regions (Ferreira 2012).
The disease symptoms vary extensively from asymptomatic or mild febrile illness to severe life-threatening shock. Factors related to the virus, host, and vector are thought to affect the disease progression and severity. That is the reason why, it is becoming a public health problem of great concern (Conroy et al. 2015; Kao et al. 2016; Ndii et al. 2016). Due to a broad range of clinical presentations and unpredictable outcomes, a classification has been required to facilitate better diagnostic and therapeutic approaches. WHO proposed a classification of dengue severity in 1997 that grouped the disease into dengue fever (DF), dengue hemorrhagic fever (DHF), and dengue shock syndrome (DSS) (Gibbons and Vaughn 2002). Due to subsequent changes in the infection epidemiology and continuous reports on the difficulties in utilizing these criteria (Guha-Sapir and Schimmer 2005; Deen et al. 2006; Rigau-Perez 2006), the WHO updated the classification, in 2009, as dengue without warning signs, dengue with warning signs, and severe dengue (Organization et al. 2009).
Primary dengue infection occurs after exposure to one dengue serotype resulting in long-lived immunity. The risk of severe infection increases after a secondary infection with a different serotype and the shift to DHF is common (Flipse et al. 2016). DHF is characterized by vascular endothelial perturbation that causes many clinical hazards ranging from effusion in the serosal cavities to shock (Kamath and Ranjit 2006). This plasma leakage can be attributed to both vascular endothelial damage and liberation of pro-inflammatory cytokines. The intercellular accumulation of the leaked fluid indicate that the leakage is mediated by immunopathological not cytopathological mechanisms (Kurane et al. 1994; Butthep et al. 2012). The inflammatory mediators, particularly histamine, may play a role in this cascade (Sanchez et al. 1986; Butthep et al. 2012). There is evidence that the cytokines released from mast cells may be involved in different forms of allergies (Sanchez et al. 1986). Studies investigating the involvement of mast cells activation in the allergy process revealed a multifaceted mechanism between the two phenomena (Gonzalez-de-Olano and Alvarez-Twose 2018; Renke et al. 2019). Therefore, the possible link of allergy in dengue may be due to this mediated player. A study in a human population revealed that mast cell activation, through its vascular endothelial growth factor (VEGF) or other mediators, participates in the development of dengue infection (Furuta et al. 2012). These findings led to another human study that investigated the occurrence of allergies in dengue fever and the results indicated a possible association (Figueiredo et al. 2010). However, the association of each specific allergy symptom and the risk of acquiring dengue infection as well as dengue severity have not been well elaborated. We hypothesized that there might be a relationship between the appearance of allergy symptoms and dengue outcome; thus, we conducted this systematic review and meta-analysis to highlight the association of allergy related signs and markers with dengue and its categories in both adults and children. Therefore, we aimed to raise the concern regarding the current dengue case classification for inclusion of other allergic symptoms in future criteria.
-
The study process was carried out in consonance with Preferred Reporting Items for Systematic Reviews and Meta-Analyses (PRISMA's checklist) (Supplementary Table S1) for systematic review and meta-analyses (Liberati et al. 2009). Our study protocol was registered with the international prospective register of systematic reviews (PROSPERO) with the identifier CRD42013004021.
-
We conducted systematic literature electronic searches (from inception of databases up to March 2013, then updated to June 2017) on PubMed, Scopus, ISI Web of Science, Google Scholar, Virtual Health Library, PsycINFO, African Index Medicus (AIM), African Journals OnLine (AJOL), Indexing of Indian Medical Journals (IndMED), SIGLE (System for Information on Grey Literature in Europe), WHOLIS databases, and WHO regional medical databases (Western Pacific Region Index Medicus). For PubMed, Scopus and ISI Web of Science, we used the following search terms: "dengue AND ("Immunoglobulin E" OR IgE OR eosinophilic OR eosinophil OR anaphylaxis OR anaphylactic OR allergy OR allergic OR allergies OR atopy OR atopic OR hypersensitivity OR dermatitis OR asthma OR eczema OR pruritus OR itching OR itchy OR urticaria OR hives)". Regarding other databases, these terms were amended to suit other databases. Besides these electronic searches, we manually searched for further potential reports through the reference lists of each included study, searching the primary studies that had cited our included papers and scanning references of the relevant papers in PubMed and Google Scholar.
-
Inclusion or exclusion of each study was determined by discussion and consensus between the two reviewers, who revised the potential reports independently, and a third senior reviewer. Studies that stated any information of dengue-infected patients who have any symptom or sign of allergy were included in our review. We omitted papers that had one of the following characteristics; (1) animal study or in vitro study without humans; (2) data could not be reliably extracted; or (3) data sets are considered overlapping. There was no restriction on language, patient age, study design, or geographical area. Two reviewers independently searched and initially screened titles and abstracts (when available) to select potential articles for further scrutiny. When the title and abstract could not be rejected by any reviewer, the full text of the article would be obtained and carefully reviewed.
-
A pilot trial was performed in order to develop the data extraction sheet. From each report, data including the first author, year of publication, study design, data collection (prospective or retrospective), country and city of participants, characteristics of patient population (gender and age), criteria of manifestation, method of diagnosis, number of included individuals (case and control groups), blinded interpretation of factors, outcomes, and times of evaluation were extracted. Papers published by the same research group and studying the same factors were checked for potential duplicate data based on the year of patient recruitment and the hospital where the patients were recruited.
-
Two independent reviewers evaluated the quality of the included studies using the National Institutes of Health (NIH) Quality Assessment Tools for case-series studies, cohort studies, cross-sectional studies and case–control studies (Health 2014). The criterion was judged as the following; a score of 13–14 was good, 9–12 was fair, and studies scoring below 9 are considered of poor quality for cohort studies. Moreover, a score of 11–12 was good, 9–10 was fair and below 9 was poor for case–control studies (Leung et al. 2015). Any discrepancy between the reviewers was solved by consensus.
-
Meta-analyses for particular factors were performed separately using Comprehensive Meta-analysis software version 2.0 (BioStat Software, Englewood, New Jersey) where there was more than one study for each outcome. The odds ratios (ORs) for dichotomous and standardized mean differences (SMDs) for continuous variables with the corresponding 95% confidence intervals (95% CI) were computed together when there were two comparable groups. The difference or the association was considered significant when the P value of the pooled effect size less than 0.05. The logit event rate (ER) was calculated to determine the proportion of presentation of each allergic symptom among dengue patients, then this logit ER was transformed into ER for simplification. Heterogeneity between studies was assessed using the Cochran's Q test and I-squared test (Huedo-Medina et al. 2006). Heterogeneity was considered statistically significant if the P value of Q test was less than 0.10 or I-squared test more than 50% (Higgins et al. 2003). We used fixed-effects model with weighting of the studies when there was a lack of significant heterogeneity and random-effects model with weighting of the studies when there was heterogeneity between studies (Munafo and Flint 2004). The effect of covariates on the summary effect size is considered significant when the P value is < 0.05 after conducting subgroup analysis. We also graphically represented the publication bias through funnel plot chart using the Egger's regression test (2-tailed test) if there were more than 10 studies (Begg and Mazumdar 1994).
Search Strategy
Study Selection
Data Extraction
Quality Assessment
Statistical Analysis and Data Synthesis
-
A total of 1903 reports were picked in our study for screening after removing 2447 duplicates by endnote software. Subsequently, 255 papers were eligible for full text screening against our inclusion and exclusion criteria which resulted in inclusion of 50 reports. An additional 7 papers were included as a result of the manual search. Finally, 57 studies were included in our study (Fig. 1). Upon the basis of study design; studies were divided as the following, 23 cohort, 17 crosssectional, 13 case-control, and 4 case series studies.In terms of risk of bias, all studies obtained fair criteria. The eligible included studies were grouped according to the reported allergy-related symptoms and markers into pruritus, asthma, non-specified allergy (in which allergy is not specified in included papers), food allergy, skin allergy, urticaria, IgE positivity, total IgE concentration, and specific IgE concentration (Supplementary Table S1 and S2).
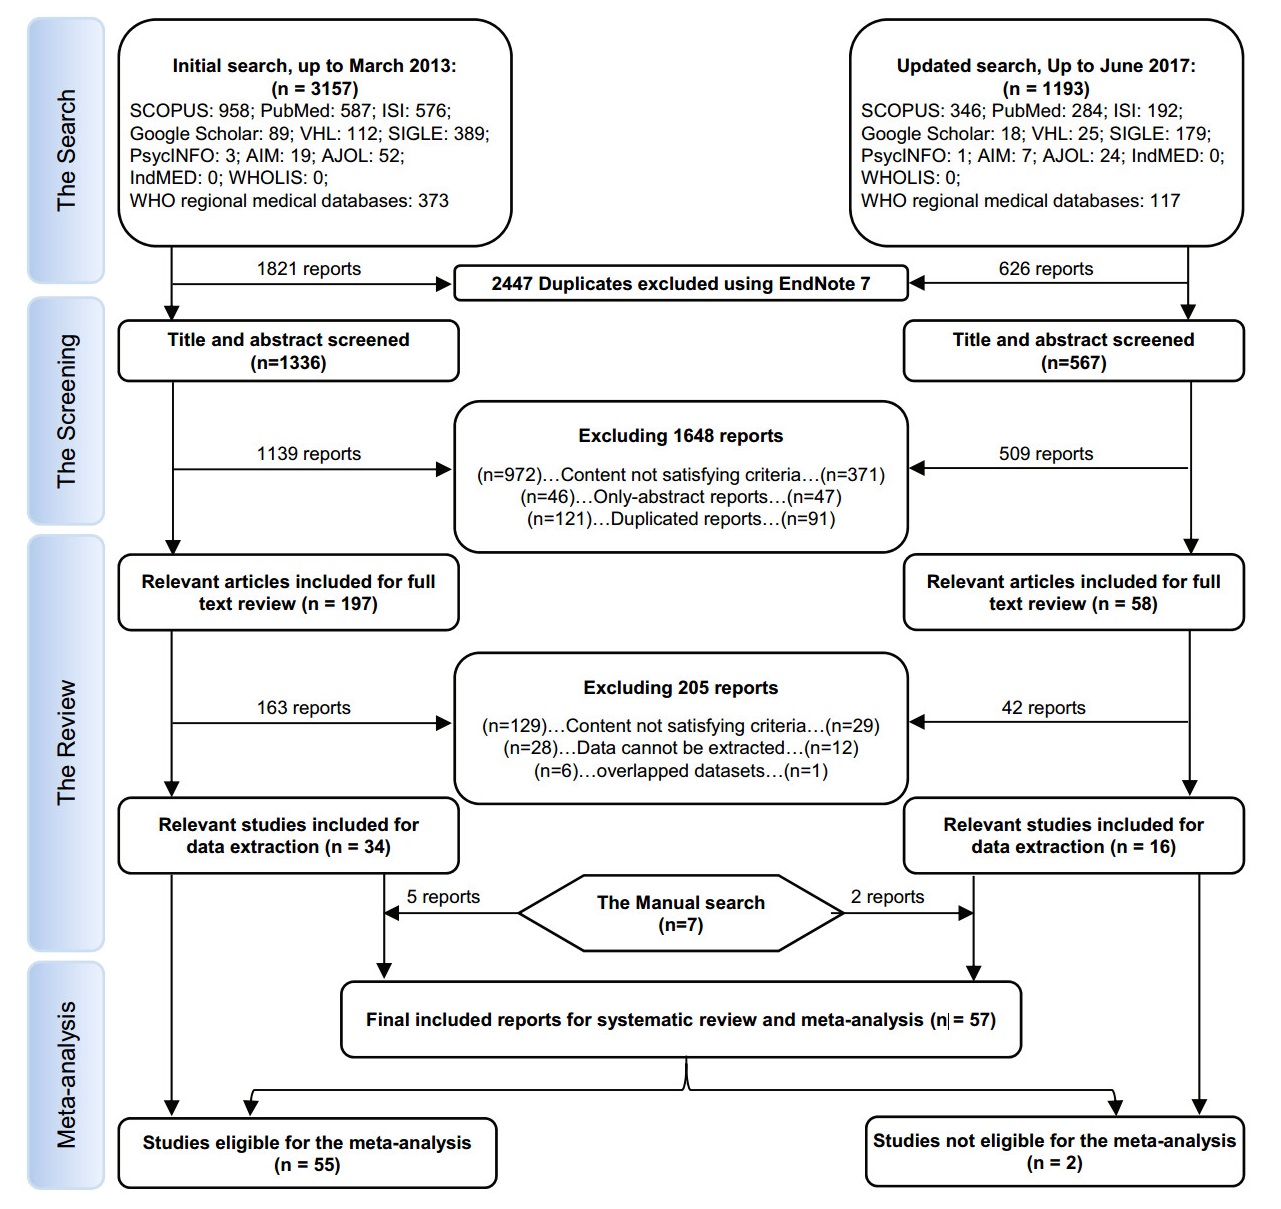
Figure 1. PRISMA flow diagram showing the process of review.
-
Pruritus was the most common allergic sign in dengue patients irrespective of dengue severity with a percent of 28.6%. Subsequently; followed by non-specified allergy and asthma with the percent of 13% and 6.5%, respectively. Only one study reported urticaria as an allergic symptom of dengue patients revealed a rate of 3.7% (Fig. 2). No publication bias was found for pruritus and asthma (P = 0.7) and (P = 0.9), respectively (Supplementary Figures S1, S2).
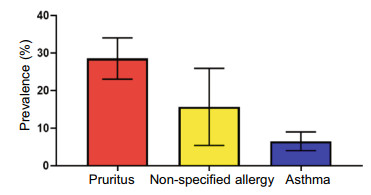
Figure 2. Bar chart for allergic signs event rate and 95% confidence interval (CI).
-
Four studies compared pruritus among dengue patients and non-dengue patients (Deparis et al. 1998; Vasconcelos et al. 1998; Passos et al. 2008; Chen et al. 2017). Significance was found between the two groups (OR 2.79, 95% CI 2.08–3.73, P < 0.001) without heterogeneity (Table 1). Total IgE level was significantly higher in dengue compared to healthy control group (SMD 0.78, 95% CI 0.22–1.34, P = 0.006) (Fig. 3) (Pavri et al. 1977; 1979; Mabalirajan et al. 2005); however the significance was lost when comparing DHF and healthy controls (P>0.05) (Pavri et al. 1977, 1979).
Variable Group 1 Group 2 No. of studies Heterogeneity Model Overall effect Name Number/total Name Number/total P value I2 (%) P value Effect size a (95%CI) Asthma DHF 97/1686 DF 210/4359 5 0.26 23.5 Fixed 0.18 1.19 (0.92–1.54) Asthmac DHF 61/868 DF 136/2892 4 0.62 0 Fixed 0.02 1.47 (1.06–2.04) Pruritis Dengue 476/1026 Non dengue 86/385 4 0.62 0 Fixed 0 2.79 (2.08–3.73) Pruritis DHF 262/544 DF 13, 353/48, 452 2 0.02 80.7 Random 0.1 2.06 (0.87 to - 4.89) Total IgE Dengue 72 Controls 101 3 0.06 64 Random 0.006 0.78 (0.22–1.34)b Total IgE DHF 44 Controls 41 2 0.03 78 Random 0.15 0.74 (- 0.28 to 1.75)b Dengue specific Seconda 148 Primary 100 3 0.88 0 Fixed 0 1.50 (1.52–1.78)b IgE level DF DF Dengue specific Seconda 148 Secondary 132 3 0.02 74.4 Random 0.95 0.02 (- 0.48 to 0.51)b IgE level DF DHF IgE positive DHF 45/53 DF 40/79 3 0.66 0 Fixed 0.01 4.44 (1.43–13.77) Allergy (non specified) DHF 174/660 DF 1127/2491 2 0 99 Random 0.53 0.49 (0.05–4.57) Food allergy DHF 30/490 DF 51/1316 1d 0.47 0 Fixed 0.05 1.59 (1.00–2.53) Skin allergy DHF 36/490 DF 65/1316 1d 0.24 26.6 Fixed 0.05 1.53 (1.00–2.34) aOdds Ratio otherwise specifically indicated.
bSDM standard difference in means.
cSensitivity analysis after removal of Pang/2012/Singapore.
dTwo data sets from the same study were pooled.Table 1. Results of the meta-analysis testing the association between dengue and allergic signs.
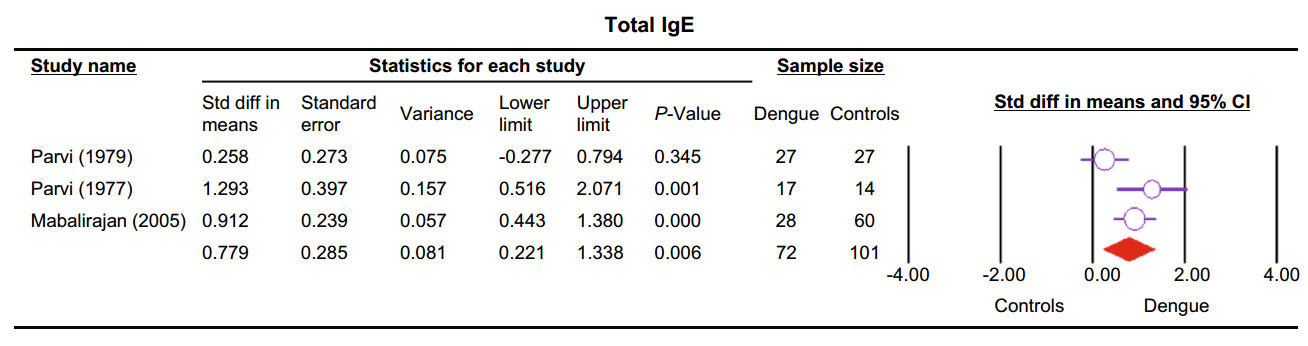
Figure 3. Forest plot showing the association between dengue and IgE level represented by standardized mean difference and 95% confidence interval (CI).
-
the Allergic Symptoms and Markers The pooled odds ratio obtained from studies comparing asthma between DHF and DF illustrated no significant difference among two groups of dengue (OR 1.19, 95% CI 0.92–1.54, P = 0.18) (Rubio et al. 2008; Figueiredo et al. 2010; Pang et al. 2012; Mahmood et al. 2013; Teixeira et al. 2015). The sensitivity analysis illustrated that the removal of Pang et al. (2012) resulted in significantly higher rate of asthma in DHF compared to DF patients (OR 1.47 95% CI 1.06–2.04, P = 0.02). Pruritus was investigated in two studies (Cordeiro et al. 2007; Rubio et al. 2008) comparing DHF with DF and revealed no significance (OR 2.06, 95% CI 0.87–4.89, P = 0.1). Similarly, the comparison of non-specified allergy across DHF and DF illustrated no significant difference in the two groups (OR 0.49, 95% CI 0.05–4.57, P = 0.53) (Figueiredo et al. 2010; Teixeira et al. 2015). One study representing two data sets (Teixeira et al. 2015) provided a comparison between DHF and DF in both food and skin allergy, and the pooled odds ratios revealed no significance in both outcomes (P = 0.05). Three studies (Vazquez et al. 2005; 2014; Bachal et al. 2015) compared IgE positivity between DHF and DF, the fixed effect model indicated significant association between DHF and IgE positivity (OR 4.44, 95% CI 1.43–13.77, P = 0.01). The pooled standardized mean difference from studies comparing dengue-specific IgE level between secondary DF and DHF indicated no significant difference between the two groups in IgE level (P = 0.95) (Fig. 4A) (Vazquez et al. 2005, 2014; Bachal et al. 2015).
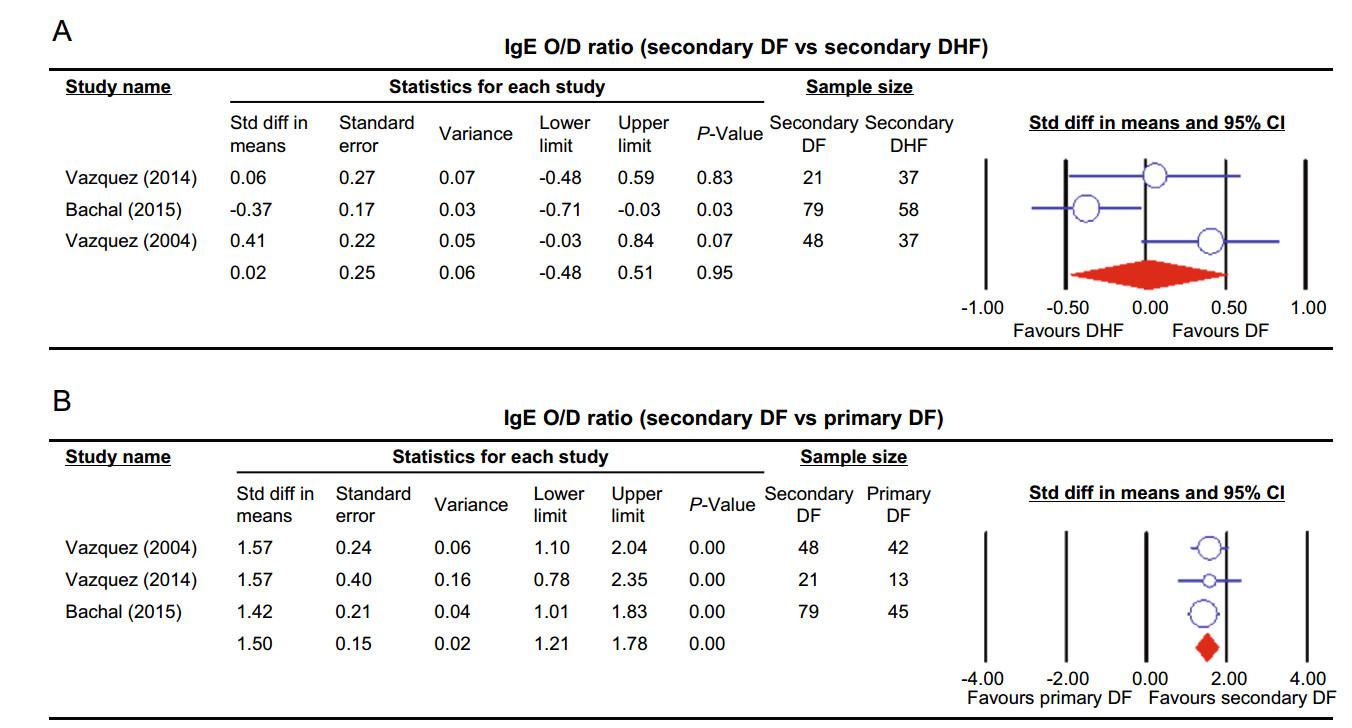
Figure 4. Forest plot of dengue-specific IgE level meta-analysis represented by standardized mean difference and 95% confidence interval (CI). A Comparison between secondary DF and DHF. B Comparison between primary and secondary DF.
-
The pooled standardized mean difference from studies comparing dengue specific IgE level between primary and secondary DF showed a significantly higher level of IgE in secondary DF (P < 0.01) (Fig. 4B) (Vazquez et al. 2005; Vazquez et al. 2014; Bachal et al. 2015).
-
Non-meta-analyzed data were illustrated in (Table 2) which consisted of two studies. Regarding the denguespecific IgE, Koraka et al. (2003) reported significant difference between primary and secondary dengue infection, IgE reference serum and either DHF or DSS, in addition to normal healthy control and either DHF or DSS. However, Míguez-Burbano et al. (1999) showed that there were differences in IgE serum concentration in corresponding to the changes in the status of serum IgM and IgG.
Study Allergic syndrome Compared groups Name N Value Name N Value Pvalue Koraka et al. (2003) in Indonesia (Values of total IgE and dengue-specific IgE in each groups were not described) Dengue-specific IgE Primary Dengue Infection 41 NR Secondary Dengue Infection 127 NR < 10-9 "IgE reference serum" 8 NR DHF 30 NR 0.03 "IgE reference serum" 8 NR DSS 67 NR 0.002 "Non-dengue febrile illness and healthy controls" 34 NR DF 71 NR 0.4 "Non-dengue febrile illness and healthy controls" 30 NR DHF 34 NR < 0.0001 "Non-dengue febrile illness and healthy controls" 34 NR DSS 67 NR < 0.0001 Total IgE (IU/mL) "Non-dengue febrile illness and healthy controls" 34 NR DF 71 NR 0.8 Total IgE (IU/mL) "Non-dengue febrile illness and healthy controls" 34 NR DHF 30 NR 0.539 Total IgE (IU/mL) "Non-dengue febrile illness and healthy controls" 34 NR DSS 67 NR < 0.0001 Míguez-Burbano et al. (1999) in Colombia Value : Mean ± SD Total IgE (IU/mL) Dengue IgM sero (+) 55 315.4 ± 19.9 Dengue IgM sero (-) 113 261.6 ± 5.9 0.016 Dengue IgG sero (+) 136 288.4 ± 5.9 Dengue IgG sero (-) 32 192.6 ± 9.3 0.01 Dengue IgG (+); IgM (-) NR 271.9 ± 8.5 Dengue IgG (-); IgM (-) NR 192.6 ± 34 0.01 Dengue IgG (+); IgM (+) NR 318.7 ± 1.3 Dengue IgG (-); IgM (-) NR 192.6 ± 34 0.01 Dengue IgG (-); IgM (+) NR 329.3 ± 1.3 Dengue IgG (-); IgM (-) NR 192.6 ± 34 0.01 NR not reported. Table 2. Summary of the studies that highlight the association of allergic symptoms with dengue severity that were not eligible for the meta-analysis.
Prevalence of Allergic Symptoms in Dengue Patients
Association of Allergic Symptoms and Markers with Dengue
Comparison between DF and DHF Regarding
Comparison between Primary and Secondary Dengue Fever Regarding Allergic Makers
Non-meta-analyzed Data Regarding Allergic Symptoms and Markers of Dengue in Range of Dengue Severities
-
In an attempt to investigate whether there is a relationship between allergy and dengue infection, we conducted a rigorous systematic review and meta-analysis to illustrate the relationships between certain types of allergy and dengue severity. In particular, the summary result of our meta-analysis revealed an association of IgE positivity and dengue severity progression, in addition to the association of dengue infection with pruritus and total IgE level.
Records of dengue-like illness date back to more than 200 years and the viral etiology of dengue virus was established in the 1940s (Ashburn and Caraig 1907; Rush 1951). Major changes in the epidemiology of dengue virus infection occurred after World War Ⅱ with geographic expansion of its transmission. Severe forms of dengue infection known as dengue hemorrhagic fever and dengue shock syndrome are sometimes fatal and need special care. The demand for identifying high risk groups in dengue patients has been sought by clinicians with the definite link between severe dengue infection and mortality in middle and low-income countries and in the absence of efficacious dengue vaccination (Anders et al. 2011; Schmidt et al. 2017). Therefore, our study raises the awareness of the increased likelihood of the progression of dengue infection into the severe form in allergic patients.
The increased rate of pruritus in dengue viral infection may be due to the excessive production of the common pruritogen, histamine, by mast cells, which play an important role in the development of pruritus (Tuchinda et al. 1977; Sanchez et al. 1986; Potenzieri and Undem 2012). The consistency among the included studies comparing dengue patients and non-dengue controls with no evidence of heterogeneity allowed us to conclude an association between pruritus and dengue infection rather than non-dengue controls that can clinically contribute in the diagnosis of the infection. We found no significance between DF and DHF patients in the presentation of pruritus, as the hallmark difference between DF and DHF is the hemorrhage, which was attributed to mechanisms other than histamine release.
Based on our analysis asthma was the least frequently occurring allergic clinical presentation in dengue patients. Notably it constitutes the least comorbidity presentation after hypertension, diabetes, and non-specified allergy (Teixeira et al. 2015). Asthma is defined as varied clinical presentation of airway obstruction and inflammatory cell activity (Fahy 2015; Mims 2015; Pang et al. 2017). Thus, the pathologic liberation of cytokines and inflammatory cells in asthma supports the vascular leakage phenomena and increase the risk of conversion into severe dengue through the previously enhanced immune system. The significant change in results following the removal of (Pang et al. 2012)—the most weighted study—can be explained by the varying characteristics of the recruited populations in the study's two epidemics such as mean age. Furthermore, the difference of viral serotypes (which was not available to the study's authors) circulating during primary or secondary infection in dengue patients may play a role in the absence of the association between DHF and asthma.
The difference between DHF and DF regarding food allergy and skin allergy was supported by the activation of mast cells with the manifestations of allergy (Brown et al. 2008). The role of mast cells and their mediators has also been reported in food allergy (Barber and Kalicinsky 2016). Interestingly, dengue infections were reported to be associated with mast cell activation and mediators (Furuta et al. 2012; Syenina et al. 2015). However, our study failed to identify a relationship between dengue severity and nonspecified allergy, with the P value for food allergy and skin allergy being 0.05. There were only three datasets, derived from two studies, in those analyses and heterogeneity was found, indicating a potential of clinical heterogeneity. In the included studies, food allergy, skin allergy, and allergy symptom were not well-described. Therefore, further investigation is needed to determine the inclusion of food allergy and skin allergy in diagnosis or decision-making about predicting dengue severity.
Different methods have been identified for dengue diagnosis including the detection of serum antibodies immunoglobulin M (IgM) and immunoglobulin G (IgG) or based on virus isolation (Guzmán and Kouri 1996; Low et al. 2011). Our analysis indicated that IgE serum positivity was associated with DHF more than DF. The pathognomonic role of interleukin-10 (IL-10), tumor necrosis factor (TNF), and mast cells activities in increasing vascular permeability provides a substantial role in IgE synthesis and production (Boesiger et al. 1998; Yaqoob and Calder 1998), which has been reported to increase in DHF (Chaturvedi et al. 2000). Furthermore, there was a statistically significant difference between primary and secondary dengue fever but this significance was lost when secondary DHF was compared with secondary DF. This indicated that IgE levels increase in secondary dengue regardless of the severity. Mabalirajan et al. (2005) also found a significant association between dengue and IgE level irrespective of severity, (P = 0.004) and IgE serum markers have been used to diagnose allergic diseases (Ezeamuzie et al. 1999) in addition to parasitic diseases (Khabiri et al. 2006), and since there was a significant rise of IgE level in dengue versus healthy controls or primary versus secondary dengue fever cases, therefore, IgE marker may be useful as a diagnostic and prognostic tool for identification of dengue infection and consequently predicting its severity, further studies are needed to confirm this utility.
Despite the present study's strengths based on comprehensive literature review with a large number of included studies, there were a few limitations in our study. First, the inclusion of some retrospective studies making the selection unavoidable. Second, the substantial heterogeneity that was found across studies might have derived from different dengue classifications and variability of diagnosis of dengue infection.
Allergy plays an important role in dengue infection. It occurs more frequently in those with more severe dengue, which suggests that there is an association between allergy symptoms and dengue severity. The results of this metaanalysis highlights that we might consider to add allergic symptoms such as asthma and IgE positivity to dengue classification which will enhance the ability of clinicians to predict the development of severe dengue disease and thereby improve clinical management.
-
We acknowledged the contributions of Nguyen Thi Huyen Trang (Hue University of Medicine and Pharmacy, Hue City, Vietnam), Nguyen Phuoc Long, Le Phi Hung, and Nguyen Thien Luan (University of Medicine and Pharmacy at Ho Chi Minh City, Vietnam), Tran Thi Minh Hue (Hanoi Medical University, Vietnam) Doan Ngoc Dinh (Health Strategy and Policy Institute (HSPI), MoH Vietnam), Tran Dinh Trung (Da Nang University of Medical Technology and Pharmacy, Da Nang City, Vietnam) on the initial work of the study.
-
NDK, AEE, AMA and NTH designed the experiments. NDK, AEE, AMA, AS, SAM, SMM, SK, MRH and KH collected the documents and summed up the data. NDK, AEE, AMA and NTH analyzed the data. NDK, AEE, AMA and NTH wrote the manuscript. All author read and approved the final manuscript.
-
The authors declare that they have no conflict of interest.
-
This article does not contain any studies with human or animal subjects performed by any of the authors.

 DownLoad: