


HTML
-
Swine influenza is an acute, highly contagious respiratory disease resulting from infection with type A influenza virus, a member of the Orthomyxoviridae family. Influenza A viruses have been isolated from different species, including humans, pigs, dogs, horses, sea mammals and birds (Kuntz-Simon G, et al., 2009; Webster R G, et al., 1987). The viruses are classified into subtypes based on antigenic properties of the external glycoproteins, hemagglutinin (HA) and neuraminidase (NA). Influenza A viruses have been further classified into 16 HA and 9 NA subtypes (Webster R G, et al., 1987; Fouchier R, et al., 2005). The proteins are highly variable and critical for the induction of antibody response in the host (Gramer M, 2008). Although other subtypes have been identified, influenza A virus H1N1, H1N2 and H3N2 subtypes are the most prevalent in pig populations worldwide (Kuntz-Simon G, et al., 2009).
In pigs, the disease is characterized by sudden onset, coughing, dyspnea, fever and prostration, followed by rapid recovery. Lesions generally develop rapidly in the respiratory tract and regress quickly. The course and severity of disease are likely to vary with the strain of the virus, age and immune status of the host (Easterday B C, et al., 1999). Morbidity is high (near 100%), but mortality is low (usually less than 1%). Recovery begins 7 to 10 days post-infection. Subclinical infections are common, and most pigs can be reinfected with other strains without showing clinical signs (Reeth V K, et al., 2006).
Porcine respiratory disease complex (PRDC), a multifactorial condition, is a serious health problem in growing and finishing pigs, and poses a threat to the swine industry worldwide. PRDC results from a combination of viral and bacterial agents, including porcine reproductive and respiratory syndrome virus (PRRSV), swine influenza virus (SIV), Mycoplasma hyopneumoniae (Myh), Actinobacillus pleuropneumoniae (APP), Pasteurella multocida and porcine circovirus type 2 (PCV2) (Kim J, et al., 2003). Although the etiology of PRDC involves multiple pathogens and varies among farms, several researchers maintain that etiology is mainly associated with Myh and PRRSV (Dee S, 1996; Thacker E L, et al., 1999). Pneumonia caused by PRDC is characterized by slow growth, decreased feed efficiency, lethargy, anorexia, fever and cough.
While farms and slaughter houses in Colombia have tested positive for SIV over the years, the role of SIV in PRDC is yet to be established. There is evidence of classic H1N1 and influenza A H1N1 Pandemic 2009 circulation in swine populations, but surveillance reports on PRDC are scarce to date. The main goal of the current research was to generate surveillance, epidemiological, antigenic as well as phylogenetic data to ascertain the presence of swine influenza (H1N1) pandemic virus and determine its association with PRDC (PRRSV, Myh, APP and PCV2) in sows from production farms in Colombia.
-
A total of 198 gilts and multiparous sows distributed in 11 farms from three major swine-producing areas in Colombia (Antioquia, Valle del Cauca and Cundinamarca) were included in the present study. Blood samples were obtained via venipuncture of the jugular vein using red top Vacutainer TM tubes. Serum samples were identified and stored at -20℃ until analysis.
-
Two hundred and forty-two nasal swabs, 8 bronchial lavage (BL) and 25 lung tissue samples of animals displaying symptoms compatible with SIV (Easterday B C, et al., 1999) were collected from the 11 farms. Samples were collected in Brain-Heart Infusion medium (BHI) medium (BD®) supplemented with 2% antibiotic and anti-mycotic solution (Sigma®), filtered through a 0.22 μm filter, and stored at -70℃ until processing for SIV isolation, either in chicken embryo eggs or the Madin-Darby Canine Kidney (MDCK) cell line.
Briefly, 9 day-old SPF embryonated chicken eggs were inoculated via the allantoic cavity with 200 μL filtered sample, incubated at 37℃ for 72 h, and monitored daily. Allantoic fluid was collected and evaluated for hemagglutination activity following standard procedures (WHO, 2005). Twenty four-well plates were seeded with 8×10⁵ cells/well of MDCK and grown in Dulbecco's Modified Eagle Medium (DMEM)(Gibco®) supplemented with 5% fetal bovine serum (FBS, Gibco®), 1% antibiotic (Sigma®) and 1% L-glutamine (Sigma®). Complete growth medium was removed from confluent monolayers and washed three times with PBS supplemented with 2 μg/mL TPCK Trypsin (Sigma®). Each well was infected with 200 μL of the original filtered sample and incubated for 1 h at 37℃, 5% CO2, followed by the addition of 2 mL/well complete DMEM. Cells were incubated at 37℃, 5% CO2, for 3-6 days and monitored daily for cytopathic effect (CPE). Following the incubation period, cell culture supernatant (CS) and allantoic fluid (AF) were collected and tested with the hemagglutination assay (HA) using chicken erythrocytes according to the standard Office International des Epizooties (OIE) protocol (Swine influenza, 2005).
-
All HA-positive samples from egg inoculation or cell culture isolation were further analyzed for efficient subtyping of virus. Viral RNA was extracted using a commercial RNA extraction kit (QIAmp viral RNA®, Qiagen, CA, USA) following the manufacturer's protocol. Amplification of HA and NA gene segments was performed with a duplex reverse transcriptionpolymerase chain reaction (RT-PCR) assay targeting the respective genes of H1N1 swine influenza virus (Choi Y, et al., 2002). Initial reverse transcription was performed with M-MVL reverse transcriptase (Invitrogen) using 4 μL viral RNA as template and the uni-12 primer (Invitrogen, Maryland, USA) to generate cDNA. The conditions for reverse transcription (RT) were as follows: 70℃ for 5 min, 94℃ for 5 min, 42℃ for 30 min, and a final step of 4℃. Amplification of 1006 bp HA (primers H1F and H1R) and 754 bp NA (primers N1F and N1R) genes of SIV was performed (Table 1) under the following reaction conditions: 94℃ for 5 min, 35 cycles of 94℃ for 1 min, 53.5℃ for 1 min, 72℃ for 1 min, followed by 72℃ for 15 min, and a final step of 4℃ to terminate amplification.
Primers bp Tm %GC Product H1 1006 pb H1F 5´GGTAGATGGATGGTACGGTTA3′ 21 53.4℃ 47.6 H1R 5´GGTCCACCAACT TGAGAAATG3′ 21 53.9℃ 47.6 N1 754 pb N1F 5´TAAATGACAAACATTCCAATGG3′ 22 49.5℃ 31.8 N1R 5´AACTATCACAGACAATAATA3′ 20 43.0℃ 25 Table 1. Primers and PCR conditions for diagnosis of SIV-H1N1
PCR products were run on an agarose gel, and isolated and gel-purified using the QIAquick Gel Extraction Kit (Qiagen®). Gel-purified products were sequenced by Macrogen®, USA, using Big-Dye® Terminator Cycle Sequencing. DNA sequences were combined and edited using the Lasergene sequencing analysis software package (DNASTAR®, Madison, Wisconsin). Multiple sequence alignments were made using Clustal W to identify related reference influenza genes. Sequence comparisons and phylogenetic relationships through a bootstrap trial of 1000 were determined with the Mega 5.1 program using the Clustal W alignment algorithm, and evolutionary history inferred using the Neighbor-Joining method (Saitou N, et al., 1987) for tree construction. Gene sequences of Colombian strains were compared with those of swine, avian and human influenza viruses, which were retrieved from the NCBI Influenza Virus Resource.
-
Serum samples were subjected to the hemagglutination inhibition test to identify antibodies against SIV using strain A/Puerto Rico 8/34 (H1N1) as antigen, according to the WHO protocol (2005).
-
PRDC was diagnosed based on detection of antibodies against PRRSV, Myh, APP and PCV2 in serum. Specific antibodies were measured with ELISA kits (Table 2).
Agent ELISA Kit PRRSV IDEXX PRRSV X3 Ab Test Mycoplasma hyopneumoniae IDEXX M. hyo. Ab Test Actinobacillus pleuroneumoniae ID VET -ID Screen® APP Screening (1-2-4-7-9-11) Circovirus Porcino tipo 2 Ingezim PCV, INGENASA Table 2. ELISA kits used to determine the presence of PRDC
-
Data were analyzed using the Statistix 8.0 program. The chi-square test was initially performed to determine the probability of presentation of respiratory disease complex with and without the presence of SIV, and logistic regression analysis subsequently utilized to determine the risk factors that increase the presentation of disease when PRDC farms and animals are positive or negative for SIV. Data were considered significant at p < 0.05, and graphs plotted using GraphPad software.
Animals
Virus Isolation
Viral RNA Extraction and RT-PCR
Hemagglutination inhibition test (HI)
Diagnosis of porcine respiratory disease complex
Statistical analysis
-
Among the 11 farms surveyed, 7 were positive for swine flu pandemic virus, either from embryo chicken egg or MDCK cell culture isolates (Table 3). Positive SIV isolates were obtained from farms located in Antioquia and Valle regions including both weaned and fattening pigs. The SIV-H1N1p strain was not found in the Cundinamarca region.
Virus Region MDCK Cells Embryo chicken Eggs A/SW/COL0102/2009/H1N1 OCCIDENTAL + - A/SW/COL0201/2009/H1N1 ANTIOQUIA - + A/SW/COL0301/2009/H1N1 ANTIOQUIA - + A/SW/COL0502/2009/H1N1 OCCIDENTAL + - A/SW/COL0602/2009/H1N1 OCCIDENTAL + - A/SW/COL0701/2009/H1N1 ANTIOQUIA + + A/SW/COL1002/2009/H1N1 OCCIDENTAL + + Table 3. Swine influenza virus isolated by region
Sequencing of the gene encoding HA resulted in grouping of strains into viruses that were circulating during the human outbreak of 2009, classified as pandemic H1N1-2009. In Figure 1, the upper part of the tree represents pandemic viruses isolated during 2009 (including California 04, 2009). These viruses showed 98.53% identity with A/swine/Colombia/0102/2009 (pH1N1) and A/swine/Colombia/1101/2009 (pH1N1) isolated from pigs in Colombia during 2009. The tree pH1N1 Colombian viruses displayed ~99% identity. The three remaining viruses showed sequence changes in HA, prompting the theory that they represent predecessors of the virus isolated in 2010 from farms within the country (Ramírez-Nieto G, et al., 2012).

Figure 1. Phylogenetic relationships of SIV-H1N1p isolated from swine-producing farms in Colombia.hese viruses show 98.53% identity with A/swine/Colombia/0102/2009 (pH1N1), A/swine/Colombia/1101/2009 (pH1N1) and A/swine/Colombia/1403/2010 (pH1N1) isolated from pigs in Colombia during 2009 and 2010. pH1N1 Colombian viruses show ~99% identity.
-
The hemagglutination inhibition test revealed positivity to SIV-H1N1p in 36.3% gilts, 33.3% sows with 1-2 births and 30.3% sows with multiparous ( > 3) births. The data suggest a trend in reactivity to SIV-H1N1p, as the antibody response appears to decrease through time.
-
PRDC presentation was lower in SIV-H1N1p-negative than SIV-H1N1p-positive farms (Table 4). The odds ratio value and p value revealed significant differences (p < 0.05) in PRDC risk presentation in gilts and multiparous sows of SIV-H1H1p-positive farms (Figure 2). Analysis was completed using logistic regression to determine the likelihood of increase in PRDC disease presentation in SIV-H1N1p-positive farms.
PRDC Negative SIV-H1N1p farms Positive SIV-H1N1p farms App 64.5% 81.1% Myh 56.9% 79.4% PCV2 87.5% 96.0% PRRSVV 15.3% 1.6% Table 4. PRDC percentage in SIV-H1N1p-positive and-negative farms
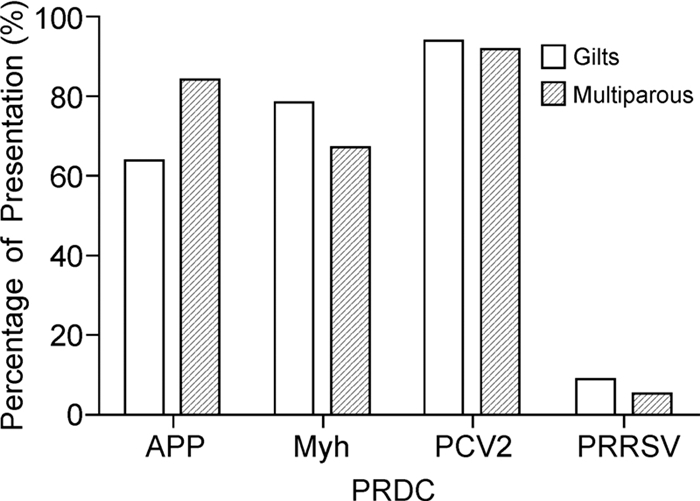
Figure 2. PRDC presentation (%) in gilts and multiparous sows from SIV-H1N1p-positive farms.
According to our results, SIV-H1N1p-positive farms had 3.19, 1.75 and 5.14 times greater risk of introduction of APP, Myh and PCV2, respectively, compared with SIV-H1N1p-negative farms. In contrast, for PRRSV, reduced risk of disease presentation (OR, 0.05) was observed in farms positive for SIV-H1N1p.
The presence of SIV-H1N1p in positive farms increases the risk of introduction of PRCD especially PCV2, APP and Myh. When analyzed byage group, the gilts are more susceptible to PCV2, Myh and APP, respectively, while multiparous sows are more susceptible to PCV2, APP and Myh.
-
Logistic regression analysis was performed to determine the risk of PRDC presentation in farms positive and negative for SIV-H1N1p. The odds ratio andpvalue revealed significant differences (p < 0.05) in risk PRDC presentation per individual. In animals positive for SIVH1N1p, major risk of Mycoplasma hyopneumoniae, PCV2 and APP presentation was 2.42, 2.08 and 1.98 times that of SIV-negative animals, respectively. In contrast, for PRRSV, the risk of presentation of disease (OR, 0.74) was decreased in animals positive for SIV-H1N1p.
Presence of swine influenza virus pandemic (SIV-H1N1p)
Hemagglutination inhibition test (HI)
Behavior of SIV-H1N1p in relation to PRDC at the field level
Behavior of SIV-H1N1p in relation to PRDC in individuals
-
Many groups have defined PRDC as a multifactorial respiratory disease involving several pathogens (Harms P A, et al., 2002; Kim J, et al., 2003; Opriessing T, et al., 2007; Fachinger V, et al., 2008), while other investigators (Thacker E L, 2006) argue that PRDC is enzootic pneumonia produced by Mycoplasma spp. and other opportunistic bacteria, aggravated by the respiratory virus.
The main goal of the present study was to conduct a systematic analysis of swine influenza virus infection and determine its role in PRDC presentation in the major swine-producing areas of Colombia. Serological reactivity determined using HI disclosed that swine influenza virus H1N1 is prevalent in gilts and multiparous sows from farms in Colombia, although the antibody response decreased over time.
We expected to find isolates from influenza of classical H1N1 virus origin in the field. Surprisingly, however, sequencing results led to grouping of viruses isolated from the farms within the original H1N1 pandemic of 2009, four of which shared 99% homology. Therefore, it is important to consider swine influenza virus of pandemic origin as a pathogen playing an influential role in the presentation of PRDC in commercial pig farms in the country.
The pandemic H1N1/09 virus (A/CA/4/09) is a swine influenza A virus subtype H1N1 strain responsible for the 2009 flu pandemic. The virus originates from swine, but was never established as circulating in pig populations before its detection in humans (Reeth V K, et al., 1996). SIV-H1N1p presentation in Colombia may have been attributed to human transmission from pigs, as reported in various countries (Weingartl H M, et al., 2010; Sreta D, et al., 2010; Pereda A, et al., 2010). This hypothesis is based on the presentation of disease outbreaks in pigs and humans, as well as reports by the World Organization for Animal Health (OIE), which documented the presence of the virus in various countries, including Argentina, Canada, Australia, Ireland and United States.
Our results indicate that SIV H1N1p positivity in animals increases the risk of presenting PRDC, particularly PCV2, APP and Myh. Primiparous and multiparous sows are more susceptible to PVC2, followed by Myh and APP in gilts, and APP and Myh in multiparous sows. A study by Hansen M S, et al. (2010) in Denmark revealed the presence of PCV2 in most lung samples from animals presenting PRDC and indicated associations of this virus with the majority of viral and bacterial pathogens. The most frequently detected pathogens were in the order PCV2, Myc hyopneumoniae, Pasteurella multocida and Myc hyohinis, identified in different proportions in pigs with pneumonia in Germany (Palzer A, et al., 2008), Taiwan (Chiou M T, et al., 2004) and the USA (Choi Y, et al., 2003). This diversity in the presentation of pathogens involved in PRDC may reflect the different diagnostic methods, health status of animals, farm management factors or simply the complex nature of pneumonia in pigs.
SIV-H1N1p-positive farms were more susceptible to PRDC presentation for both gilts and multiparous sows, and interactions were mainly observed among PCV2 and SIV. Research in animals between 18 and 20 weeks of age showed that SIV acts together with PCV2 in pigs under field conditions. PRDC induces severe clinical disease lesions presenting both influenza and wasting syndrome post-weaning (Dorr P, et al., 2007; Pallares F J, et al., 2002). Wei H, and co-workers (2010) concluded that subclinical PCV2 infection results in increased severity of subsequent SIV-H1N1 infection and SIV can trigger the severe form of PCV2, although the percentage of animals affected is comparable to that reported for other co-infections known to trigger severe PCV2.
Myh is associated with presentation of swine enzootic pneumonia, characterized by high morbidity and low mortality in affected farms (Opriessing T, et al., 2012). Myh acts as an immunosuppressant by increasing its pathogenicity as well as that of SIV at the time of replication of the two agents (Opriessing T, et al., 2012, Yazawa S, et al., 2004). Thacker E and colleagues (2001) reported that the percentage of lung lesions and clinical presentation of disease in pigs inoculated with SIV 21 days after inoculation with Myh is higher than that in pigs inoculated with Myh only. In our study, higher risk (1.7%) of introduction of Myh in SIV-H1N1p-positive farms was observed, compared to SIV-H1N1p-negative farms.
APP, a highly contagious infectious agent, causes pleuropneumonia in pigs, characterized by increased susceptibility to secondary infections (Gutierrez C, et al., 2000). APP is considered an obligate parasite of the respiratory tract of pigs (Taylor D J, 1999). This report is consistent with the present study, where SIV-H1N1ppositive farms displayed 81.1% positivity for APP. APP has two different biotypes, specifically, biotype 1 containing 12 serotypes and biotype 2 with six serotypes. All biotypes are capable of causing disease, with some serotypes being more aggressive than others (Bossé J T, et al., 2002). APP is reported to increase the incidence of stress associated mainly with pleuropneumonia and interactions with viral and bacterial agents involved in the introduction of PRDC (Bossé J T, et al., 2002; Kim J, et al., 2003).
Regarding PRRSV presentation in SIV-H1N1ppositive and -negative farms, the incidence of PRRSV was lower in positive (1.6%) than negative farms (15.3%). Co-infection studies of PRRSV and SIV have yielded conflicting results in terms of clinical disease. In animals experiencing swine influenza infection and PRRSV infection as a secondary pathogen, the disease is exacerbated, leading to prolonged fever, increased cough and weight loss (Van Reeth K, et al., 1996; Kitikoon P, et al., 2009). On the other hand, prior infection with PRRSV does not aggravate acute SIV presentation but can generate subsequent chronic infection (Pol J M, et al., 1997).
PRRSV is transmitted transplacentally through direct contact after birth, and piglets from infected mothers are infectious during subsequent stages of production, particularly the fattening and finishing stages (Prieto C, et al., 1997). Similarly, SIV is transmitted by direct contact between infected and uninfected animals via aerosol and can affect animals at any stage, particularly during fattening and finishing, as the pigs are raised in very close proximity to each other (Van Reeth K, et al., 1996). For this reason, we expected to find significant interactions between the two viruses in multiparous sows. However, this was not observed in our study.
Regarding tropism, PRRSV has high affinity for differentiated macrophages. Destruction of these cells in the lung by PRRSV is suggested as the key event causing lung susceptibility to secondary pathogens (Gucht S V, et al., 2014; Van Reeth K, et al., 1994). PRRSV and SIV are the primary etiologic agents associated with respiratory disease of pigs in the United States (Choi Y, et al., 2003) and co-infection could explain this role in porcine respiratory disease complex presentation. Primary SIV infection of epithelial cells of the airways results in cellular necrosis, production of inflammatory mediators and rapid infiltration of phagocytic cells, including lung alveolar macrophages (PAM) susceptible to PRRSV infection. SIV infection-inflammation may increase the target cells for initial infection of PRRSV, resulting in increased and prolonged pneumonia (Kitikoon P, et al., 2009). Based on results from the current study, we propose that SIV-H1N1p blocks PRRSV replication or vice versa, and presentation of the disease is dependent on virulence and the time interval between infections (Kitikoon P, et al., 2009).
PRDC results from a combination of infectious agents as well as environmental stressors and challenges that affect the health of pigs, resulting in reduced performance, increased medication costs and high rates of mortality. Clearly, the different forms of presentation of respiratory disease in pigs are attributed to the interactions of viral and bacterial agents, and although the etiology of PRDC involves multiple pathogens with variations among farms, limited information is available on the spread of the virus in our pig population. The current study showed that PCV2 and APP are the main viral-bacterial agents interacting with SIV-H1N1p in positive animals. Although it is difficult to establish whether swine flu virus is a pandemic primary, secondary or opportunistic agent, our data clearly indicate that SIV-H1N1p plays an important role in the presentation of PRDC, signifying the need to increase agricultural surveillance to prevent future outbreaks.
-
This study was supported by Colombia's Agriculture Ministry, Colombian Association of swine producers, Cercafe and National University of Colombia. We are grateful to Mirela Norho for statistical analysis and farms of Antioquia y Valle del Cauca that participated in the study.
-
The authors declare no conflicts of interest in terms of financial relationships with the industry or directly with the academy. All experiments were performed in accordance with the institutional and national guidelines for the care and use of laboratory animals.
-
JJC, GCR, VJV designed experiments. LFM performed experiments. LFM analyzed data. LFM and JJC wrote paper. All authors read and approved the final manuscript.


 DownLoad: