


HTML
-
Herpes simplex virus 1 (HSV-1), a member of α herpesviruses, is the cause of infectious oral herpes, herpetic keratitis, herpes progenitalis, and even lethal herpetic encephalitis, and it shows a high infectivity rate of 30%– 60% in populations of various ages (Lan and Luo 2017). Among infected individuals, approximately 1.50 million cases of herpetic keratitis due to HSV-1 infection have been reported each year worldwide according to annual epidemiological data; moreover, more than 17.7 million U.S. dollars are needed for the clinical treatment of approximately 500, 000 herpetic keratitis cases annually (Farooq and Shukla 2012). Some drugs that are currently used for HSV-1 infection inhibit the viral DNA polymerase (Kukhanova et al. 2014), but recurrent viral infections are difficult to treat. Thus, vaccine development would be an effective strategy for controlling this infectious disease. However, HSV vaccine candidates that were evaluated in different stages of clinical trials during the past 20 years have not shown protective efficacy against viral infection (Awasthi et al. 2008; Cattamanchi et al. 2008; Belshe et al. 2012), suggesting that an improved understanding of the immune profile of infected individuals and its associated mechanisms is needed (Stanfield and Kousoulas 2015; Johnston et al. 2016; Rajcani et al. 2018).
Various studies of the immune profile during HSV-1 infection in patients and animal models have suggested that the immunity induced in virus-infected individuals usually increases specific neutralizing antibody levels and activates the cytolytic effect of T cells (Wakim et al. 2008; Royer et al. 2016). This immunity has been reported to be capable of controlling viral infection or viral reactivation. Viral reactivation from the latently infected trigeminal ganglion was controlled to some extent via locally activated specific CD8+ T cells (Khanna et al. 2003; Knickelbein et al. 2008). However, the role of neutralizing antibodies in controlling viral reactivation and reinfection has not been determined. These features of HSV-elicited immune responses are different from those of immune responses elicited by some other viruses. Generally, components of viral pathogens that enter the epithelium can be recognized by cellular pattern recognition receptors (PRRs) (Paludan et al. 2011), followed by activation of the nuclear factor (NF)-κB transcription system and the induction of innate immunity (Abe and Barber 2014). Immune signaling molecules that are then secreted by the epithelium are capable of activating various innate immune cells for antigen phagocytosis and presentation. The ultimate effect is the induction of specific immunity, such as neutralizing antibody production and/or cell-mediated cytolytic effects.
HSV uses an immune evasion strategy during viral replication in the epithelium, which involves various virusencoded proteins (Zheng 2018). HSV-encoded molecules also interfere with cellular apoptosis, which is an important innate immune mechanism for eliminating pathogeninfected cells (Galvan and Roizman 1998). Virus-encoded Us3 and Us5 were found to be capable of interacting with cellular proteins that mediate the apoptosis process during viral infection (Leopardi et al. 1997; Aubert et al. 2006). Us3 was described as a serine/threonine protein kinase that is capable of phosphorylating the cellular pro-apoptotic protein (Bad) to prevent Bad-induced apoptosis (Cartier et al. 2003). Us5, which is also named glycosylated J-protein, was predicted to inhibit Fas-mediated apoptosis, probably by interfering with the trimerization of Fas or inhibiting the recruitment of Fas-associated molecules to the death-inducing signaling complex (Jerome et al. 2001). These interactions of viral proteins with immune defensive components reflect viral interference with innate and adaptive immune responses and imply that the immune response against HSV infection might be defective.
Based on various data related to the viral strategy of immune evasion during infection, our previous work aimed to study the mechanism by which HSV-1 strain attenuation interferes with the viral immune evasion strategy by genome modification. In that study, the UL7, UL41, and LAT genes were partially deleted by CRISPR/Cas9 in the HSV-1 8F strain, followed by clone sorting and identification of the biological characteristics of the strain (Xu et al. 2017a). The experiment not only discerned that proteins encoded by the UL7 gene are capable of regulating viral genome transcription but also provided an attenuated strain with mutated UL7, UL41 (encoding the Vhs protein), and LAT genes (Xu et al. 2016). This mutant M3 virus showed an attenuated phenotype in mice and rhesus macaques, with asymptomatic infection in the animals and a lower viral load in various organs, especially in the nervous system (Xu et al. 2017a; Fan et al. 2018). Importantly, the infected animals were observed to show protection against wildtype challenge (Xu et al. 2017b). However, the immunity elicited by the mutant did not seem to eliminate viruses (including the mutant virus itself and the virus used for challenge) from animal tissues, including in the trigeminal ganglion, which was a focus for evaluating effective antiviral immunity against HSV. To further understand how the attenuation of the virus by gene modification impacts the viral immune evasion strategy via inhibiting cellular apoptosis, in the current work we constructed a novel mutant containing mutated UL7, UL41, LAT, Us3, and Us5 genes to generate an attenuated strain with low virulence and better immunogenic effects. This M5 virus was created with CRISPR/Cas9 based on the M3 strain and was demonstrated to enhance the humoral immune response and the T cell cytolytic response, which resulted in a higher neutralizing antibody titers and more effective elimination of the virus in vivo in a mouse challenge test.
-
The African green monkey kidney Vero cell line (ATCC, Manassas, USA), HaCat keratinocytes cell line (KIZ, CAS, Kunming, China), and the KMB17 cell line (IMB, CAMS, Yunnan, China) were maintained in high-glucose Dulbecco's modified Eagle's medium (DMEM; Corning, Corning, USA) supplemented with 10% fetal bovine serum (HyClone, Logan, USA). The Jurkat human T lymphocyte cell line (ATCC) was cultured in Roswell Park Memorial Institute (RPMI) 1640 Medium (Biological Industries, Cromwell, USA) supplemented with 10% fetal bovine serum. The culture medium was changed to DMEM or RPMI-1640 supplemented with 2% fetal bovine serum after viral infection.
-
The pathogenic HSV-1 strains McKrae and 17+ and the HSV-1 mutant M3 (Xu et al. 2017b) were used in the experiments. The mutants were identified by PCR and subsequent sequencing of PCR products, and the mutated clones were acquired through plaque screening in KMB17 cells. Vero cells were then used to detect viral titers. All virus-related experiments were performed in a large room under biosafety level 2 conditions.
-
The method of recombinant mutant virus construction was similar to that used to establish the M3 strain (Xu et al. 2017b). Briefly, two sets of guide RNAs (g-RNAs) were designed to target the Us3 and Us5 genes according to the protocol reported by Ran et al. (2013). The genomic regions surrounding the CRISPR target sites of the genes were PCR amplified with the primers Us3-F, Us3-R, Us5-F, and Us5-R. The specific primer sets used are listed in Supplementary Table S1. The g-RNA dsDNA fragments were annealed and inserted into the CRISPR/Cas9 system vector PX330 (Addgene, Cambridge, USA). The plasmids were transfected into 293T cells using the Fugene HD reagent (Promega, Madison, USA), followed by infection of the cells with the M3 virus. The M4 virus with a partial Us3 deletion mutation was harvested from infected 293T cells at 48 h post infection (h.p.i.), and viral genomic DNA was extracted using the TIANamp Virus RNA/DNA Kit (Tiangen, Beijing, China). The genomic region surrounding the CRISPR target site of the Us3 gene was PCR amplified using PrimeSTAR DNA polymerase (Takara, Dalian, China), and the products were analyzed on 1.5% agarose gels, stained with ethidium bromide (EB) and imaged using a Bio-Rad Gel Doc (Bio-Rad, Richmond, USA) gel imaging system. After detecting the mutation efficiency, the mutated virus was purified via a plaque assay. The M5 mutant was then constructed based on the M4 mutant strain.
-
The HSV-1 wild-type (WT), M3, and M5 viruses were used to infect KMB17 cells at a multiplicity of infection (MOI) of 0.1 at 37 ℃. The total viral yield from the cell culture supernatants and the infected cells was assessed at several time points (8, 16, 24, 32, 40, and 48 h.p.i.). The titers of all samples were determined by standard virus titration in Vero cells.
-
Morphological changes related to apoptosis were observed using DAPI staining and fluorescence microscopy. Jurkat or HaCat cells were split to log phase and incubated for 12 h at 37 ℃. The cells were then infected with WT, M3, and M5 mutant viruses at a density of 1 plaque-forming unit (PFU)/cell or mock-infected and incubated at 37 ℃ for 24 h (Jurkat cells) or 8 h (HaCat cells). Infected cells were fixed with formaldehyde and stained with DAPI. Cells were then coated on a glass slide and observed by a fluorescence microscope. Live cells showed no characteristics of apoptosis. Apoptotic cells showed membrane shrinkage, membrane blebbing, and/or nuclear fragmentation.
-
BALB/c mice were killed after anesthetization with ether, and the spleens were removed aseptically into Hank's Balanced Salt Solution (Corning, Corning, NY, USA). A single-cell suspension was prepared through gentle dispersion of the cells. Red blood cells were removed using 5 mL of mouse lymphocyte separation solution (Solarbio, Beijing, China) per mouse spleen for 30 min. The cells were washed and suspended in RPMI-1640 medium supplemented with 10% heat-inactivated fetal bovine serum, 100 U/mL penicillin, and 100 μg/mL streptomycin.
-
Annexin V and PI staining was performed with an Annexin V-FITC Apoptosis Detection Kit according to the manufacturer's instructions (BD Biosciences, San Diego, USA). Briefly, Jurkat cells or HaCat cells were incubated for 12 h at 37 ℃, followed by mock infection or infection with WT, M3, and M5 mutant viruses at an MOI of 1 and incubation at 37 ℃ for 24 h (Jurkat cells) or 8 h (HaCat cells). The infected cells were collected by centrifugation at 300 ×g for 10 min, washed twice with cold phosphatebuffered saline (PBS), and centrifuged at 300 ×g for 10 min. The cells were suspended in 1×binding buffer at a concentration of 1×10⁶ cells/mL. Then, 100 μL of the solution (1×10⁵ cells) was transferred to a 5 mL culture tube, and 2 μL of FITC Annexin V and 2 μL of PI were added. The cells were gently mixed and incubated for 15 min at room temperature (25 ℃) in the dark, then, 400 μL of 1×binding buffer was added to each tube. The stained cells were analyzed by a BD LSRFortessaTM cell analyzer (BD Biosciences, San Diego, USA). The analysis was completed within 1 h.
-
Four-week-old female BALB/c mice weighing 10–13 g (Vital River, Beijing, China) were purchased and housed in the pathogen-free facility of the Institute of Medical Biology. All efforts were made to minimize the suffering and discomfort of the animals. The mice were maintained under a 12-h light/dark cycle (lights on at 08:00 h) at 22 ± 1 ℃. The animals were housed five per cage and allowed free access to food and water. Prior to the experiments, the animals were routinely acclimated (> 1 week) to laboratory conditions to reduce potential stress effects during the experiments.
For part one of the mouse study, BALB/c mice were anesthetized under 2% isoflurane inhalation and infected via the intranasal route (which is a relatively good route for establishing an HSV-1 infection model) with 104 PFU of the M5 strain, the WT McKrae strain, or PBS (sterile, pH 7.4; mock infection) as a control. Tissues were obtained at 3, 7, 28, and 56 days post viral infection and subjected to assessments of viral load and mouse organ pathology.
For part two of the mouse study, BALB/c mice were anesthetized under 2% isoflurane inhalation and infected via the intranasal route with 104 PFU of the HSV-1 M3 strain, the HSV-1 M5 strain, or PBS (sterile, pH 7.4; mock infection). The infected mice were divided into three groups: infection, 28 days post infection (d.p.i.) challenge, and 56 d.p.i. challenge group. At 28 and 56 d.p.i, mice of the infection group were killed. Serum and splenic lymphocytes were collected for neutralizing antibody testing and ELISpot assays, respectively. In addition, at 28 and 56 d.p.i., the rest of the mice were challenged with the HSV-1 WT strains McKrae and 17+ (1×10⁴ PFU/ 50 μL/mouse) via the intranasal route, as described for the first viral infection. After viral challenge, the weights of the mice were measured every 2 days. The survival rate was assessed over a 10-day period. Serum and splenic lymphocytes were collected at 8 and 12 days post viral challenge for neutralizing antibody testing and ELISpot assays, respectively. Tissues were obtained at 4, 8, and 12 days post viral challenge and subjected to assessments of viral load and mouse organ pathology.
-
A neutralization assay was performed in accordance with standard protocols. Briefly, the serum samples were heatinactivated. A mixture of diluted serum (1:4, 1:8, 1:16, 1:32, 1:64, 1:128, and 1:256) and virus at a titer of 100 times the 50% cell culture infectious dose/100 μL were incubated for 2 h at 37 ℃. The mixture was then added to Vero cells in 96-well plates and incubated at 37 ℃. Cytopathic effects (CPEs) were observed after 1 week to determine the neutralizing antibody titer of the serum. In the virus regression experiment, after the positive, negative, and cellular control groups were all established, assessments of the test samples could be performed. Serum samples with 100% CPE in the assay were judged to be negative for neutralizing antibodies, and serum samples for which more than 50% of the cells were protected were judged to be positive for neutralizing antibodies.
-
Splenic lymphocytes were isolated as described above. A mouse IFN-γ ELISpot Kit (MABTECH Inc., Cincinnati, OH, USA) was used according to the manufacturer's protocol. Briefly, the plate was conditioned and seeded with splenic lymphocytes prior to the addition of 10 μL of the stimulant (two peptides (gB498-505: SSIEFARL and ICP6822-829: QTFDFGRL) (Sangon Biotech, Shanghai, China), with 95% purity and a concentration of 10 μg/mL for each protein), which mainly targeted CD8+ T lymphocytes (Salvucci et al. 1995; Wallace et al. 1999; St Leger et al. 2011). The cells were then incubated at 37 ℃ for 30 h. After incubation, the cells were removed, and the plate was developed. The colored spots were counted using an automated ELISpot reader (CTL, Cleveland, OH, USA), with spot-forming cells representing HSV-1-specific IFNγ-producing T cells.
-
The mouse organs were fixed in 10% formalin and embedded in paraffin in tissue blocks. Approximately two slides per organ were stained with hematoxylin and eosin (H&E) to assess morphology.
-
To show the change in expression of the targeted proteins, the mRNA of the WT, M3, M4, and M5 strains were purified using the Trizol reagent (Tiangen). cDNAs were then synthesized using a PrimeScriptTM 1st Strand cDNA Synthesis Kit (Takara). The full length of Us3 and Us5 genes were PCR amplified by using PrimeSTAR DNA polymerase (Takara) with specific primers (Supplementary Table S2), and the products were analyzed on 1.5% agarose gels, stained with EB, and imaged using a Bio-Rad Gel Doc gel imaging system. The amplification products were further sequenced.
The viral load in the brain and trigeminal ganglion was determined by qPCR with absolute quantitation. Based on the methods of Kessler et al. (2000), the primers for the reaction were selected within a highly conserved region of the UL30 DNA polymerase gene from the HSV-1 genome, allowing for amplification of a 92-bp fragment from HSV-1 DNA. The primers were UL30-F: 5'-CATCACCGACCC GGAGAGGGAC-3' and UL30-R: 5'-GGGCCAGGCGCT TGTTGGTGTA-3'. In addition, a standard curve was produced from standard DNA samples (p-GMT plasmid ligated to the UL30 gene fragment). Viral genomic DNA was extracted from mouse tissue using a Universal DNA Purification Kit (Tiangen). The TaqMan probe (Sangon Biotech, Shanghai, China) was 5'-6FAM-CCGCCGAACT GAGCAGACACCCGCGC-TAMRA. The reactions were performed using Premix Ex TaqTM (probe qPCR; Takara) on an ABI 7500 thermocycler (Life Technologies, Carlsbad, CA, USA).
-
An in situ hybridization assay was performed using Enhanced Sensitive ISH Detection Kit I (POD) (Boster, Wuhan, China) according to the manufacturer's instructions. Briefly, the frozen sections were fixed with 4% paraformaldehyde for 20 min at room temperature. The sections were immersed in 0.6% hydrogen peroxide in methanol to block intrinsic peroxidase activity. After three rinses with distilled water, pepsin digestion was performed, followed by treatment with prehybrid solution for 3–4 h. Twenty microliters of the LAT probe (5'-CATAGAGAGCCAGGCACAAAAACAC-Dig-3', 1 μg/mL in hybrid solution) was pipetted onto each sample and left overnight in a humidity chamber. The sections were treated with serial solutions: sealing liquid for 30 min, a mouse anti-digoxin (anti-DIG) antibody for 60 min, SABC solution for 20 min, anti-mouse horseradish peroxidase (HRP)- polymer for 20 min, and diaminobenzidinechromogen (DAB) for 10 min. After being rinsed with water, the sections were stained with H&E to assess the cell nuclei. LAT positivity was evaluated in the whole cell. Cells with any brown dot-like signal were considered to be positive for LAT expression. Cases with no such signal were considered negative for LAT expression.
-
The results of various assays, which were performed in triplicate, are expressed as the mean values with the standard error of the mean. SPSS software was used for statistical analyses. The weights of the infected mice were evaluated using repeated measures analysis. Survival analysis was performed to analyze the survival rate of infected mice. Differences in viral load between two groups were evaluated using an independent samples t test or two-way ANOVA. A value of P < 0.05 was considered significant.
Cells
Viruses
Construction of Recombinant Mutant Viruses
Preliminary Analysis of the M5 Virus
Morphological Assay Using 4', 6-Diamidino-2- Phenylindole (DAPI)
Preparation of Mouse Splenic Lymphocytes
Annexin V and Propidium Iodide (PI) Staining
Mouse Study Design
Neutralization Assay
Interferon (IFN)-γ-Specific ELISpot Assay
Histopathological Examinations
RT-PCR and Quantitative (q)RT-PCR
In Situ Hybridization
Statistical Analysis
-
Based on the M3 mutant, we designed specific g-RNA sequences targeting the Us3 and Us5 genes according to the technical requirements of CRISPR–Cas9 (Supplementary Table S1). The mutated plasmids were then constructed. Based on the previously reported method (Xu et al. 2016), we first generated a deletion of the Us3 gene in the genome of M3. After modifying the sequence of the Us3 gene, the mutant M4 was cloned and isolated. Similarly, we also deleted the Us5 gene in the M4 mutant (Fig. 1A) and ultimately isolated the mutant M5 (Fig. 1A, 1B). Further sequencing results showed that the Us3 gene contained a deletion from 1248 to 1393 bp and that the Us5 gene contained a deletion from 227 to 390 bp (Fig. 1C). During the experiment, we passaged the M5 mutant for approximately 15 generations, and the deletions in the Us3 and Us5 genes were always stable during this process (results not shown). To identify the mutations in M5, based on the previously reported sequence result for the M3 strain, we not only verified the mutated target genes of UL7, UL41, LAT, and Us3/Us5 but also assessed 12 genes related to viral replication, immune evasion, and viral structure, including RS1, RL1, RL2, Us6, Us12, UL5, UL15, UL23, UL29, UL44, UL48 and UL49 (Supplementary Table S3; Supplemental file S1). The results confirmed that the target genes were mutated and the remaining genes related to viral immune evasion were unaltered (Supplemental file S1). Moreover, to explore the change in expression of the targeted proteins, we purified the mRNA of the WT, M3, M4, and M5 strains. The cDNAs were then synthesized and used to amplify the Us3 and Us5 genes. The result showed frameshift mutations in the Us3 and Us5 genes (Fig. 1D; Supplementary file S2). In addition, compared with that of the WT strain, the M3 and M5 mutants exhibited a reduced proliferation capacity in human diploid cells (Fig. 1E). These results suggest that mutations in the Us3 and Us5 genes do not affect the proliferative capacity of the HSV-1 M3 mutant.
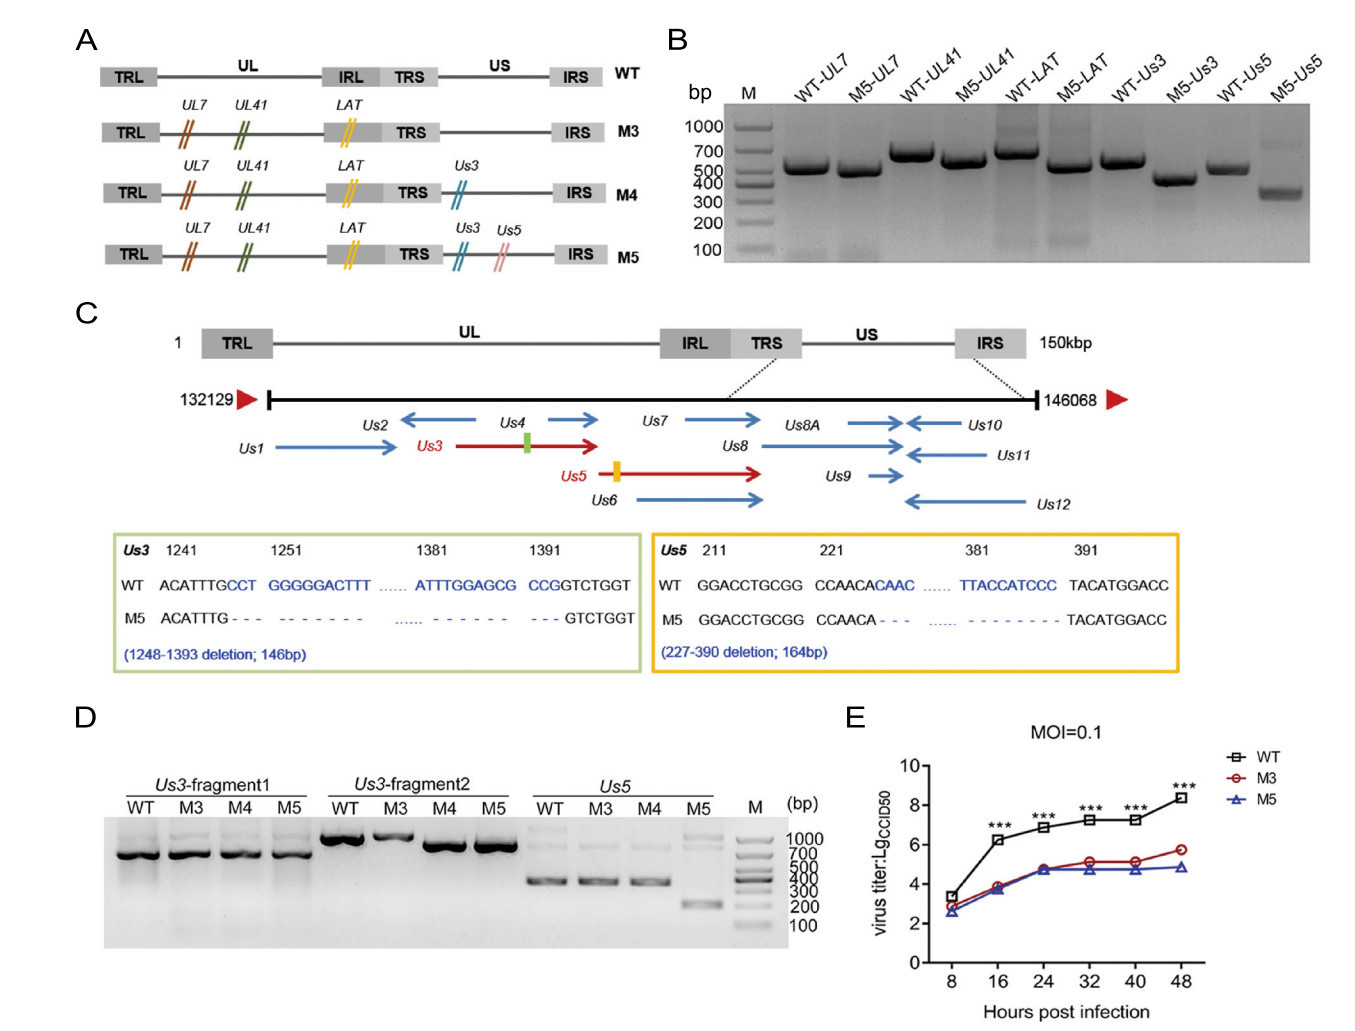
Figure 1. Identification of the mutated genes and dynamic growth characteristics of the M5 strain in cultured cells. A Flowchart of the design and construction of the M4 and M5 viruses. B Identification of the mutated Us3 and Us5 genes in the M5 strain. The mutations were identified via PCR using specific primers. C Identification of the mutated site in the Us3 and Us5 genes in the M5 strain. D Identification of the mutated site of the mRNA in the Us3 and Us5 gene in the M5 strain. E Growth curve of the M3, M5, and WT strains in KMB17 cells. ***P < 0.001.
-
A large number of studies have shown that the Us3 and Us5 genes are involved in the immune escape process during viral infection, mainly by inhibiting apoptosis induced by cytotoxic T lymphocytes (CTLs)(Aubert et al. 2006). However, HSV-1 is capable of encoding various proteins to regulate apoptosis in infected cells. The biological effect of a single protein might be compensated by other proteins. Therefore, we aimed to observe the rate of apoptosis in cells infected by the strain with mutated Us3 and Us5 to confirm the relationships of these genes with the viral capacity to inhibit cellular apoptosis as an immune evasion strategy. Cultured Jurkat human T lymphocytes were infected with the WT, M3, and M5 mutant strains at an MOI of 1. Cell apoptosis was evaluated through DAPI staining at 24 h post viral infection. In contrast to the rare apoptotic cells among the WT virus- or M3-infected cells, 10%–30% of the cells in the M5-infected groups were morphologically distinct, with cell volume contraction, chromatin condensation, and the formation of membraneenveloped apoptotic bodies in the visual field (Fig. 2A). To further test the above observations, we used Annexin V and propidium iodide (PI) to dual-label cells and to quantitatively detect the number of apoptotic cells with flow cytometric analysis. The results showed that apoptosis occurred in 4.35% and 5.04% of cells infected with the WT and M3 viruses, respectively, and in 21.31% of cells infected with M5 virus (Fig. 2B, 2E).
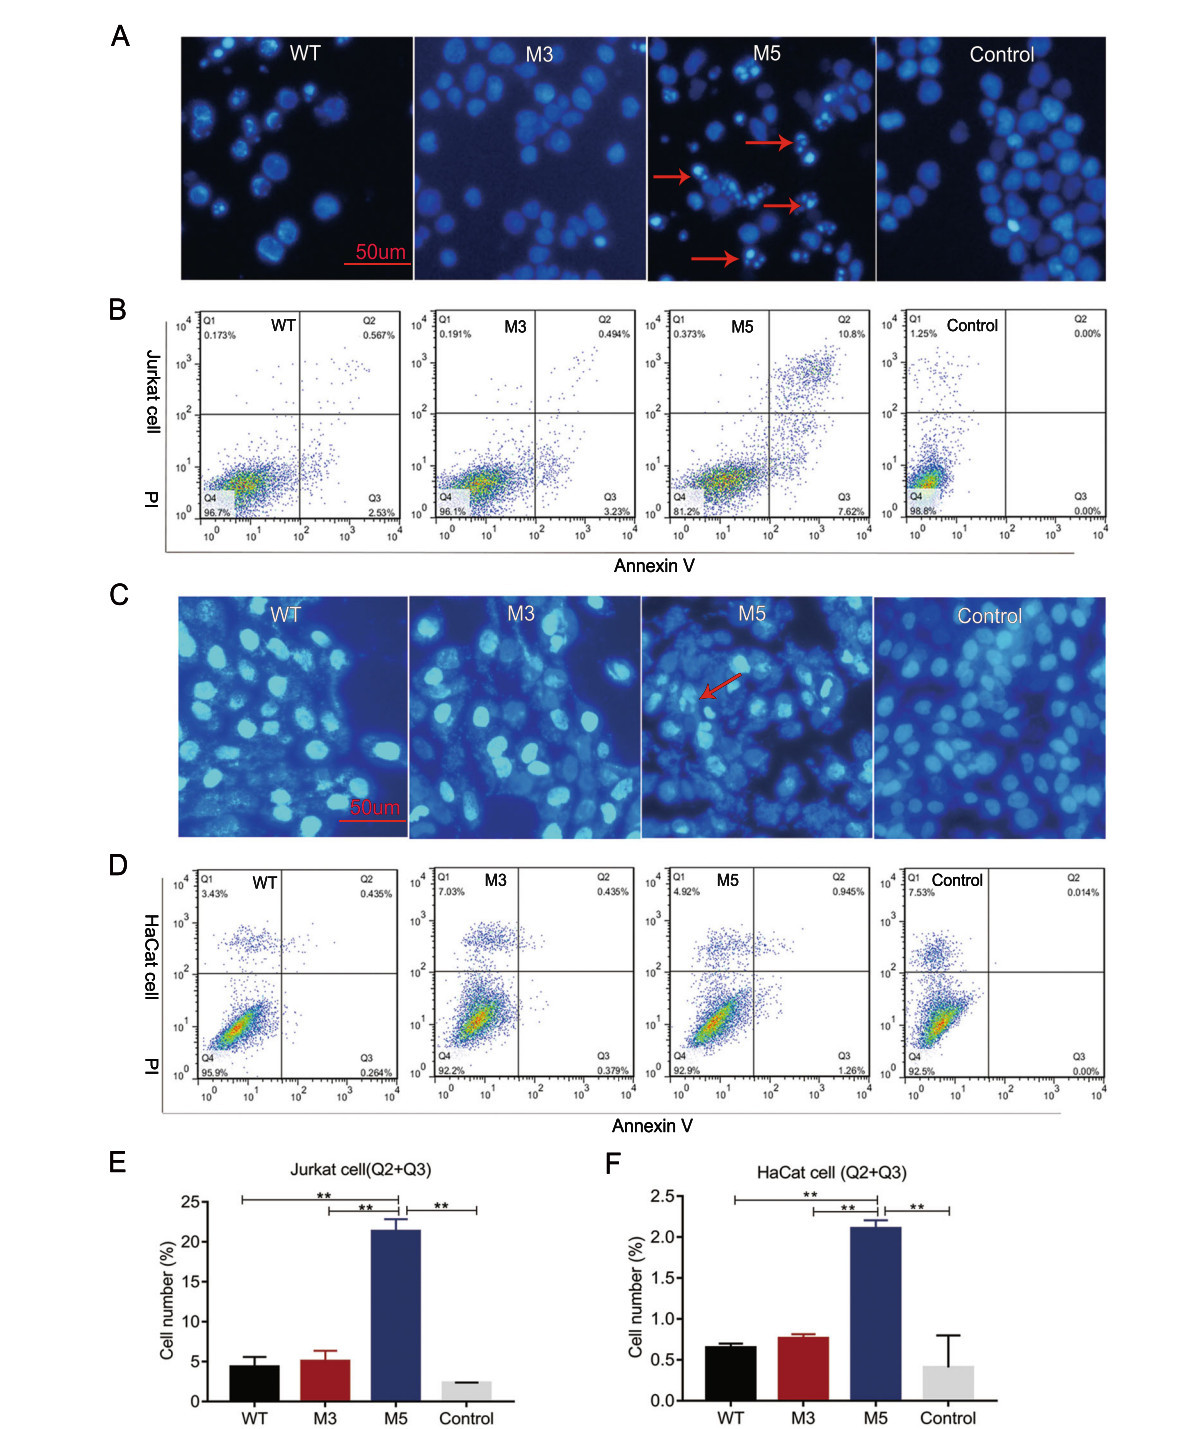
Figure 2. Analysis of apoptosis in Jurkat cells or HaCat cells infected with the WT, M3, or M5 strain. A, C The infected Jurkat cells or HaCat cells were stained with DAPI. The stained cells were visualized using fluorescence microscopy. Apoptotic cells show hyperfluorescence and nuclear fragmentation, and these cells are indicated with red arrows. B, E Jurkat cells were stained with Annexin V and propidium iodide (PI) at 24 h post viral infection. Flow cytometric analysis results and the percentage of Annexin V and PI-positive cells are presented. D, F HaCat cells were stained with Annexin V and PI at 8 h post viral infection. Flow cytometric analysis results and the percentage of Annexin V and PI-positive cells are presented. Jurkat or HaCat cells without viral infection were stained with Annexin V and PI as control group. **P < 0.01.
Furthermore, examining the apoptosis induction in infecting physiologically relevant mucosal cells such as HaCat keratinocytes may provide more important information about future use of the M5 strain. Cultured HaCat cells were infected with the WT, M3, and M5 mutant strains at an MOI of 1. Cell apoptosis was evaluated through DAPI staining at 8 h post viral infection. In contrast to the rare apoptotic cells among the WT virus- or M3-infected cells, few of the cells in the M5-infected groups were morphologically distinct (Fig. 2C). Moreover, we used Annexin V and PI to dual-label cells and to quantitatively detect the number of apoptotic cells with flow cytometric analysis. The results showed that apoptosis occurred in 0.65% and 0.76% of cells infected with the WT and M3 viruses, respectively, and in 2.11% of cells infected with M5 virus (Fig. 2D, 2F). These results suggested that the Us3 and Us5 genes might be involved in the inhibition of virus-related apoptosis.
-
Our previous work on mice infected by the M3 strain revealed attenuated viral pathogenesis, which presented as reduced inflammatory reactions in various organs in association with a lower tissue viral load (Xu et al. 2017b). In the current work, we used the M5 strain to infect mice at a dose of 104 PFU by the intranasal route, and mock-infected control mice were established with PBS inoculation (Fig. 3A). Histopathologic examination of various organs from M5-infected mice at days 3, 7, 28, and 56 post infection indicated that all tissues, especially nervous system tissues, showed only slight infiltration of inflammatory cells without obvious pathologic lesions (Fig. 3B), which was similar to our observations in mice infected with M3 (Xu et al. 2017b). This pathologic feature was associated with asymptomatic infection until day 56 post infection. These data suggested an attenuated phenotype of M5 characterized by a non-pathologic phenotype compared with that of the WT strain. Further detection of the viral load in tissues collected from M5-infected mice indicated a significantly lower viral load in central nervous system (CNS) tissues, including the brain and trigeminal ganglion (Fig. 3C, 3D), which might lead to the observed attenuated phenotype of M5.

Figure 3. The attenuated phenotype of the M5 strain in mice. A Design of the mouse experiment for the M5 strain infection. Mice were infected with WT, M5, or mock (PBS) via the intranasal instillation of 1 × 10⁴ PFU. B Pathological changes in the cerebrum in mice infected with WT, M5, or PBS. The tissue sections were stained with hematoxylin and eosin and imaged using an optical microscope. Tissue hyperemia and infiltration of inflammatory cells detected at 7 d.p.i. are indicated with blue and black arrows, respectively. Scale bars = 100 μm. Assessment of viral load in the brain (C) or trigeminal ganglion (D) of mice infected with WT, M5, or PBS, as determined by RT-qPCR. The viral copy numbers were quantified according to an HSV-1 DNA standard. The data are shown as the mean ± SEM based on data from three independent mice. *P < 0.05; **P < 0.01;***P < 0.001.
-
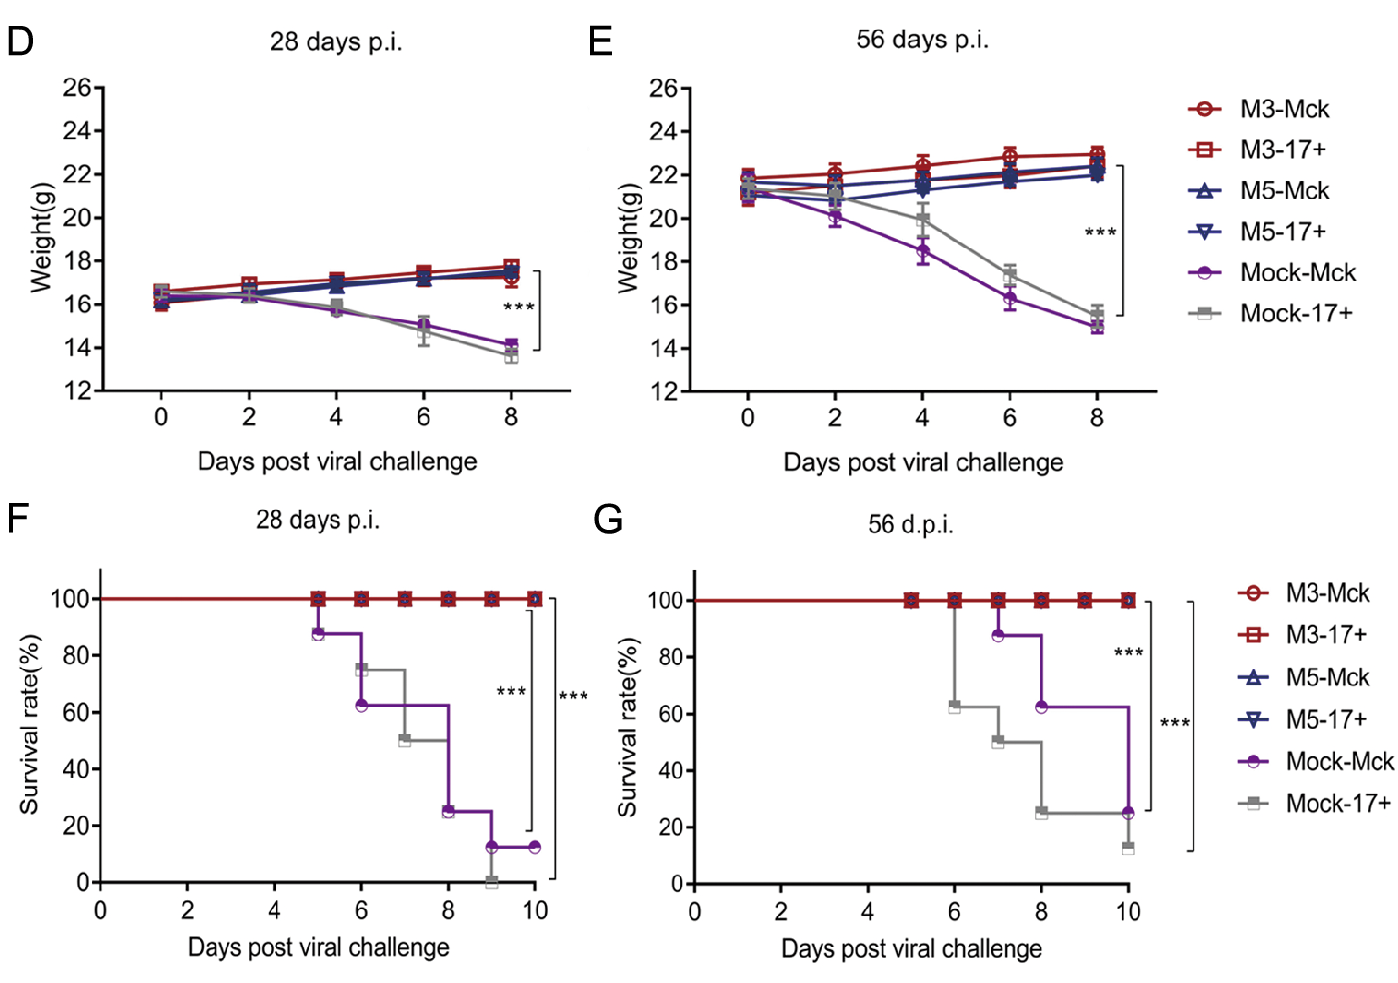
Based on observations of the discrepant ratios of cellular apoptosis induced by M5 and the WT strain in Jurkat human T lymphocytes and HaCat cells, we inferred that M5 lost, to some extent, the inhibitory effect on cellular apoptosis that is usually observed during WT infection and is one of the mechanisms of viral immune evasion (Yu and He 2016). We hypothesized that M5 might present better immunogenicity than the WT and M3 strains in mice. Therefore, mice infected with M3, M5, or mock-infected (PBS) were used for further experiments, as described in Fig. 4A, in which the mice infected with M3, M5, or mockinfected (PBS) were challenged separately with the HSV-1 WT strains McKrae and 17+ at a dose of 104 PFUs through the intranasal route. The results did not reveal any visible pathological symptoms in any inoculated mice from the groups infected with the M3 and M5 strains (group: M3 and M5) until 56 days after infection. Importantly, at 28 or 56 days after M5 infection and before WT challenge, all M5-infected mice exhibited a positive serum-neutralizing antibody response with a titer of 1:4–1:8 (Fig. 4B), while the ELISpot assay with the HSV-1 membrane protein gB and ICP6 antigen stimulation showed an obvious positive IFN-γ-specific response (Fig. 4C). Further pathological observations of mice infected with M3 or M5 followed by challenge with the respective WT strains (groups: M3- McK, M3-17+, M5-McK, and M5-17+) for 56 days revealed no visible pathological symptoms in any individual (Table 1). The body weights of these mice increased normally (Fig. 4D, 4E), while most of the mice in the mock-McK and mock-17+ groups showed back arching, inverted hair, blindness, paralysis, and even death. At 28 days post challenge, all the mock-McK mice developed one or more symptoms (Table 1). Serious symptoms in mice in the mock-McK and mock-17+ groups included orbital inflammation and keratitis, and blindness (whitening of the transparent cornea and the black pupil). Moreover, the mice had a survival rate of only 12.5% (Fig. 4F). Similarly, all mock-17+ mice developed one or more of the above symptoms on the 6th day post challenge and showed a survival rate of 0% at 28 days (Fig. 4F). However, no death was found in mice infected with M5 followed by challenge with the McKrae or 17+ strains until 56 days post immunization (Fig. 4G), similar to the M3 group.
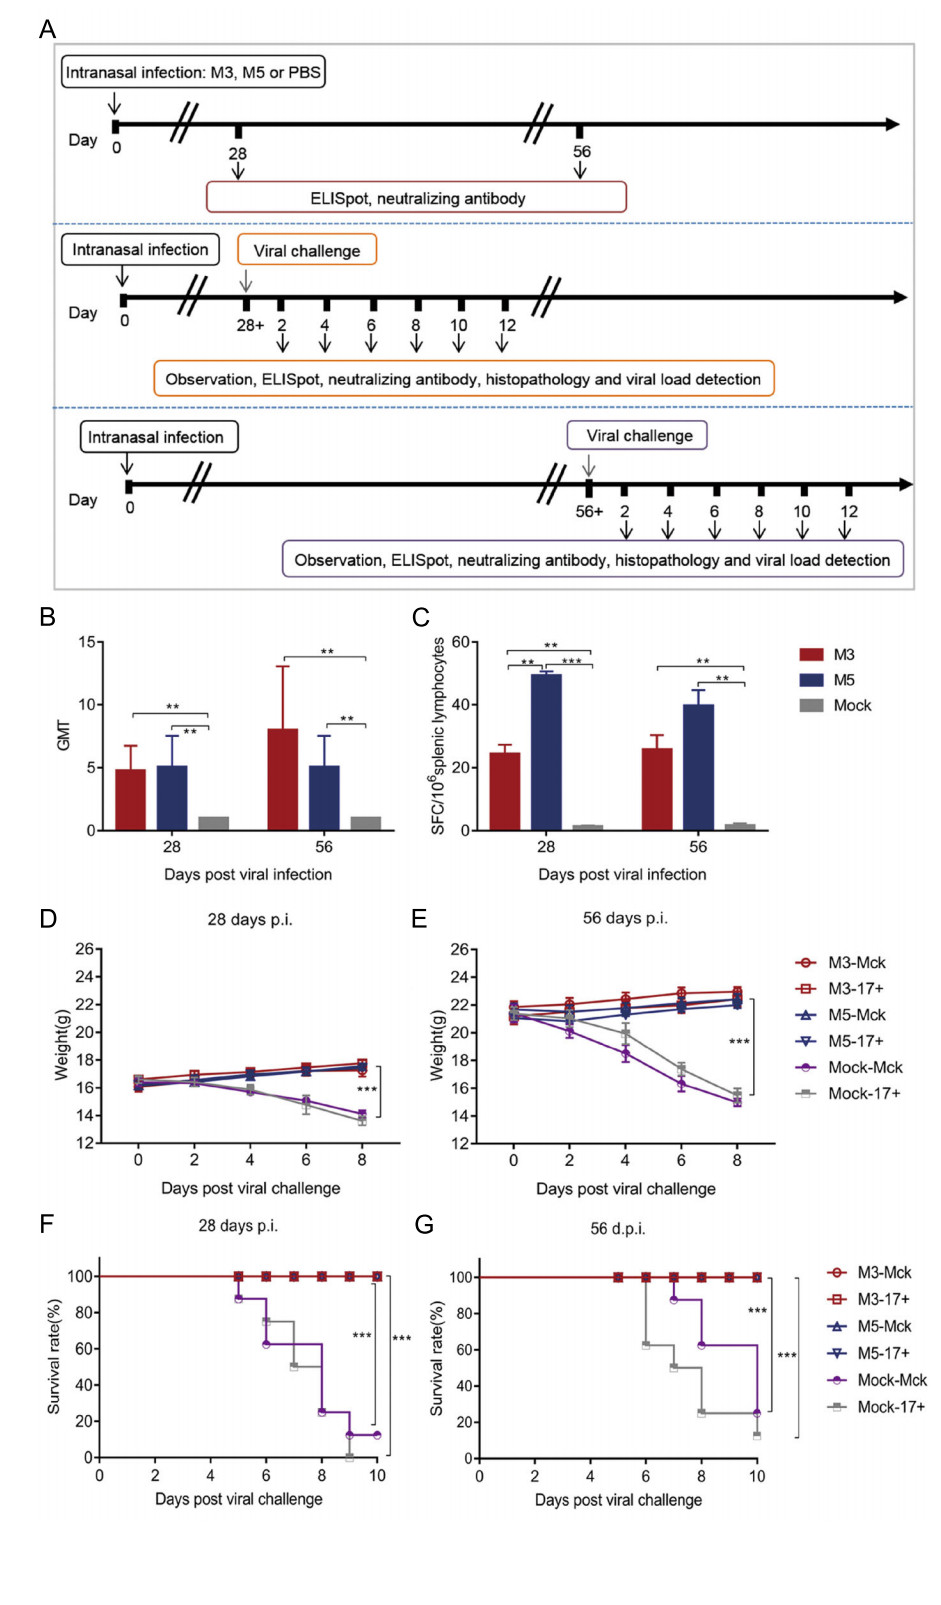
Figure 4. Immune response to HSV-1 induced in mice infected with either the HSV-1 mutant M3, the HSV-1 mutant M5, or PBS and pathological observation of WT-, M3-, and M5-infected mice after viral challenge. A Design of the mouse experiment. B The neutralizing capability of antibodies specific for HSV-1 in mice infected with HSV-1 M3, HSV-1 M5, or mock infected (PBS) (n = 3 for each). The geometric mean titers (GMTs) of neutralizing antibodies were measured by a neutralization test as described in the methods. The GMT values for the mock (PBS) groups were all < 2. C ELISpot responses to IFN-γ-secreting cells from splenic lymphocytes in HSV-1 M3- infected, HSV-1 M5-infected and mock-infected (PBS, n = 3 for each) mice. Splenic lymphocytes were incubated for 24 h in the presence of a stimulus. The positive control was phytohaemagglutinin (PHA). D–G The M3-, M5-, or mock-infected mice were challenged with WT virus at 28 (D, F) or 56 (E, G) days post viral infection. D, E The weights of the mice were measured every 2 days. F, G The morbidities of mice were observed over a 10-day period. The values are presented as the mean ± SEM. **P < 0.01; ***P < 0.001.
Pathologic symptoms 28 d.p.i. 56 d.p.i. M3-
McKM3-
17+M5-
McKM5-
17+Mock-
McKMock-
17+M3-
McKM3-
17+M5-
McKM5-
17+Mock-
McKMock-
17+Back arching 0 0 0 0 87.5 87.5 0 0 0 0 75 87.5 Inverted hair 0 0 0 0 100 87.5 0 0 0 0 75 87.5 Unilateral blindness 0 0 0 0 62.5 87.5 0 0 0 0 37.5 37.5 Monoplegia 0 0 0 0 0 75 0 0 0 0 0 0 Death 0 0 0 0 87.5 100 0 0 0 0 75 87.5 Table 1. Pathological manifestations of M3-infected, M5-infected, or mock-infected mice infected with WT virus (%; n = 8).
Further dynamic detection of immunity after viral challenge suggested that the immune response induced by M5 presented an increased anti-HSV-1 neutralizing antibody titer of 1:128 (Fig. 5A, 5B) and high levels of IFN-γ-specific lymphocyte proliferation from days 8 to 12 post challenge, which was clearly higher than that in the groups infected with the M3 or WT strains (Fig. 5C, 5D). Moreover, the viral loads in CNS tissues, especially various parts of the cerebrum and trigeminal ganglion in M3- or M5-infected mice, suggested a lower trend than those detected in tissues from the mock-infected mice (Fig. 5E–5H). Importantly, the tissue samples from the challenged individuals presented pathologic characteristics similar to those of tissues from animals infected with only M5. However, the CNS tissues of mock-McK and mock-17+ mice showed an obvious inflammatory reaction with extensive inflammatory cell infiltration, including aggregation of these cells around vesicles and hyperemia in the cerebrum (Fig. 5I). All these results indicated that M5 is capable of eliciting immunity against WT virus infection.
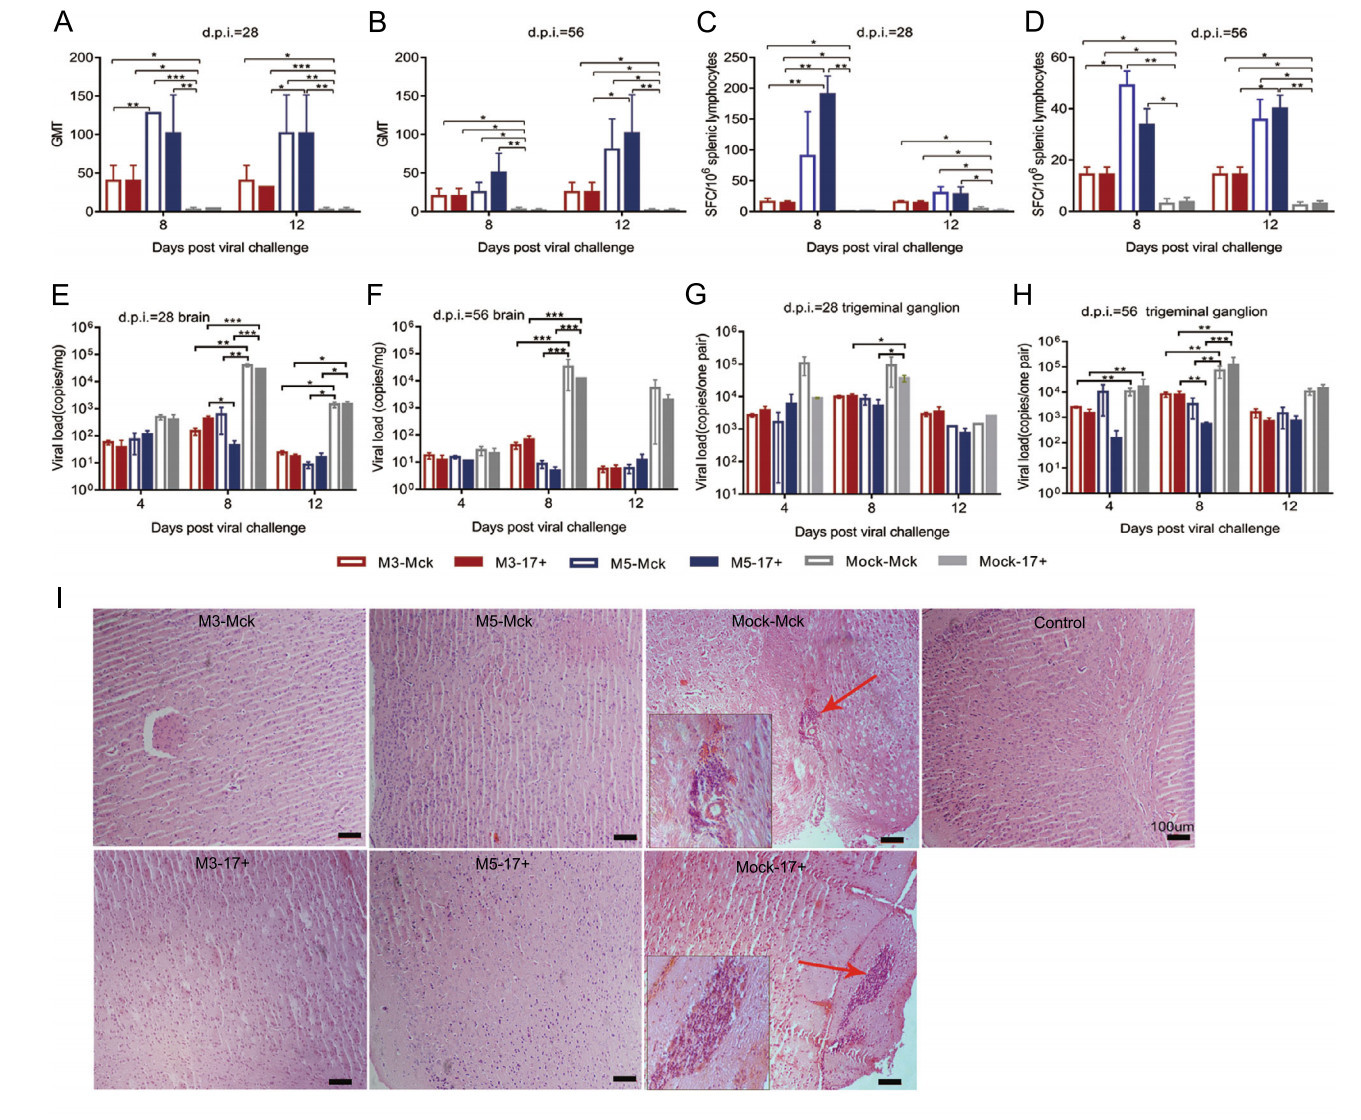
Figure 5. The immunity induced by M3 or M5 is capable of inhibiting viral replication in infected individuals. A, B The neutralizing capability of antibodies specific for HSV-1 in M3-, M5-, or mockinfected and HSV-1 WT-challenged mice. The geometric mean titers (GMTs) of neutralizing antibodies were measured by a neutralization test as described in the methods. C, D ELISpot responses to IFN-γ-secreting cells from splenic lymphocytes in M3-, M5-, or mockinfected and HSV-1 WT-challenged mice. Splenic lymphocytes were incubated for 24 h in the presence of a stimulus. The positive control was PHA. E, G Viral load in the brain (E) or trigeminal ganglion (G) of M3-, M5-, or mock-infected and WT-challenged mice at 28 days post infection (d.p.i.). F, H Viral load in the brain (F) or trigeminal ganglion (H) of M3-, M5-, or mock-infected and WT-challenged mice at 56 d.p.i. The values are presented as the mean ± SEM. *P < 0.05; **P < 0.01; ***P < 0.001. I Pathological changes in the cerebral tissues of mice challenged with HSV-1 WT virus (4, 8, or 12 d.p.i.) at 28 or 56 d.p.i. Tissue sections were stained with H&E and imaged using an optical microscope, scale bars = 100 μm. Tissue hyperemia and infiltration of inflammatory cells are indicated with red arrows.
-
The above results indicated that the effective immunity induced in M5-infected mice, which presented as humoral and cellular responses, was capable of controlling the viral proliferative capacity of the M5 strain and the WT strain in various organs of mice. Therefore, the analysis of latent HSV-1 infection in the trigeminal ganglion was a key point for evaluating the immunity induced by the M5 strain with deficient inhibition of cellular apoptosis. Using in situ hybridization with a primer specific for the LAT gene, we detected the level of LAT transcripts in trigeminal ganglion tissues from M3- or M5-infected mice subjected to subsequent WT challenge and mock-McK or mock-17+ -infected mice. The results showed a stronger hybridized transcript signal in the trigeminal ganglion of mock-McK and mock- 17+ mice at 12 d.p.i., and a weaker or absent LAT transcript signal was observed in the M3- or M5-infected mice (Fig. 6A). To verify this observation, trigeminal ganglion tissue samples were homogenized and co-cultured with a monolayer of Vero cells to observe cytopathic effects. The results showed a significant cytopathic effect in the co-culture system with samples from mock-McK- and mock17? -infected mice after only 5 days, but the Vero cells co-cultured with the samples from M3- or M5-infected and challenged mice remained negative after 12 days (Fig. 6B). This finding suggested that latent viral infection in the trigeminal ganglion was inhibited in M5-infected and challenged mice.
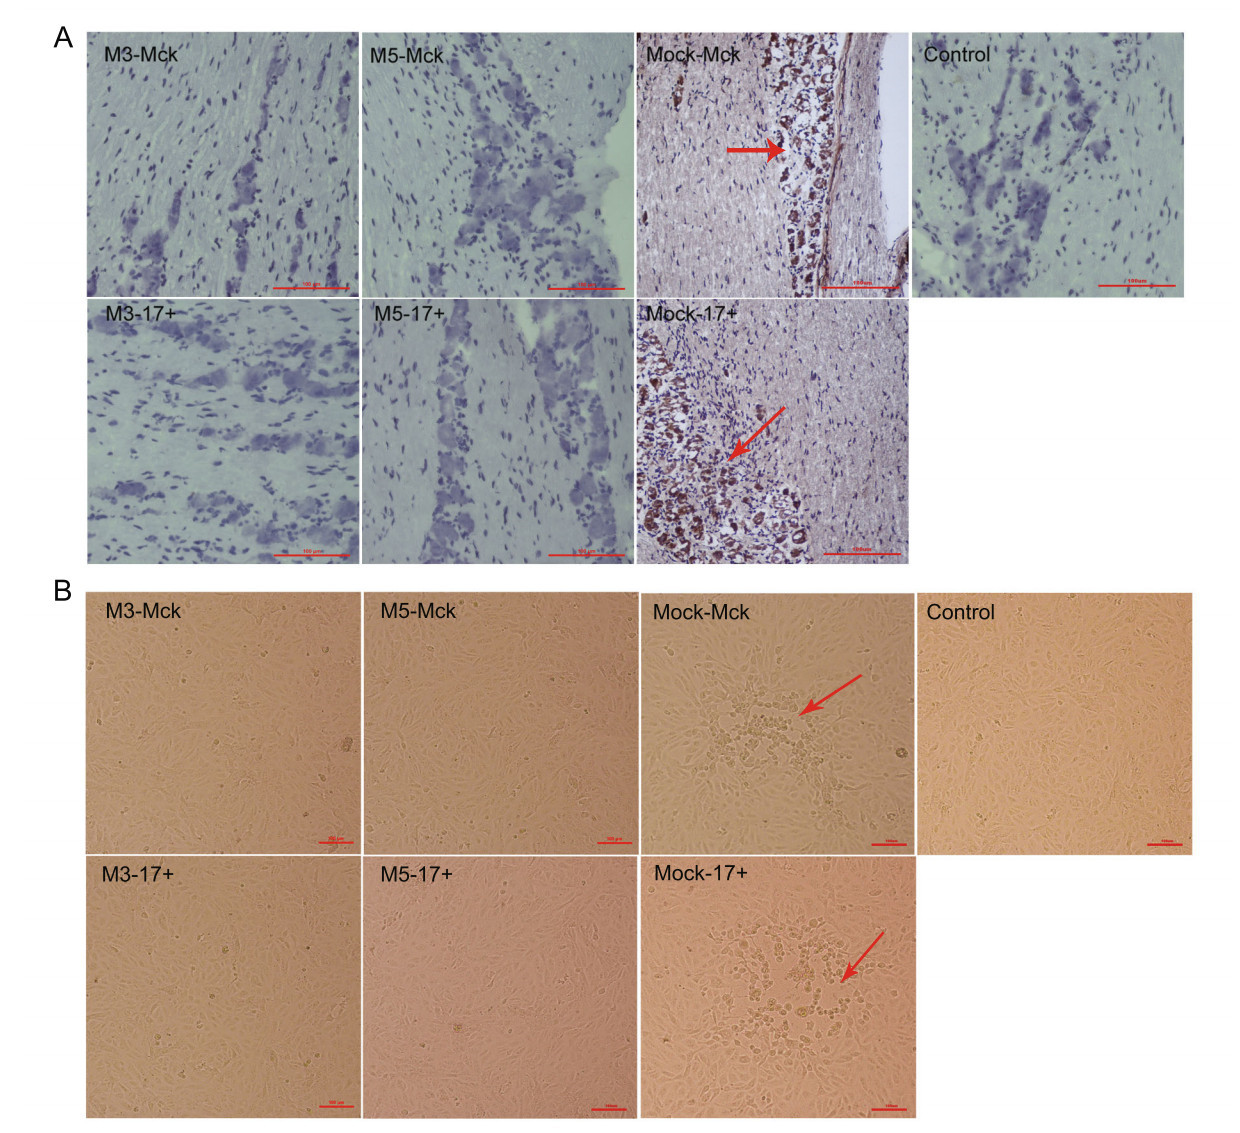
Figure 6. Latent infection of HSV-1 WT is reduced in mice infected with M3 or M5. A The levels of LAT expression in the trigeminal nerves of mice at 12 days post challenge with WT virus after 28 or 56 d.p.i., as determined by in situ hybridization. Positive LAT RNA expression in the trigeminal nerves of mice by chromogenic in situ hybridization is indicated with red arrows. Brown dot positivity is observed in mock-infected mice. No positive signal was observed in M3- or M5-infected mice, scale bars = 100 μm. B Vero cells cocultured with trigeminal ganglion tissues from M3-, M5-, or mockinfected and WT-challenged mice at 12 days post viral challenge. CPE is indicated by red arrows; scale bars = 100 μm.
Determination of the Modified Genomic Sequence and Phenotypic Characteristics of the HSV-1 M5 Mutant
A Higher Rate of Cellular Apoptosis Was Induced in Cells Infected with M5 than in Cells Infected with the WT or M3 Mutant Strain
Pathologic Processes Are Alleviated during M5 Infection Due to Restricted Viral Proliferation In Vivo
M5 Is Capable of Inducing Immunity, with Better Protective Efficacy Compared with the WT Strain
Restricted Latent Infection Was Observed in the Trigeminal Ganglion in M5-Infected Mice, Even After Challenge with the WT Strain
-
As a double-stranded DNA virus with a complicated genomic structure and transcriptional mechanism, HSV-1 can lead to specific acute pathological manifestations and latent infection in the trigeminal ganglion (Lan and Luo 2017). Infected individuals with this pathologic process present with recurrent lifelong herpetic symptoms and continuous presence of the virus in vivo (Mostafa et al. 2018; Watson et al. 2018). This observation suggests not only that HSV-1 exhibits neurotropic activity but also that the anti-viral immunity that is induced during viral infection may not be effective. Previous data related to this characteristic of HSV suggested that the strategy of immune evasion involved various virus-encoded molecules during successive stages of infection and was responsible for pathogenesis (Koyanagi et al. 2017; Zheng 2018). This strategy is also an important reason for the lack of effective prophylactic HSV vaccines (Coleman and Shukla 2013). To investigate the detailed mechanism of this viral immune evasion, in our previous work, we constructed isotypic strains with different mutated viral genes to understand the role each viral gene involved in viral immune evasion during infection using the CRISPR/Cas9 gene mutation method. In these works, the UL7 gene was identified as being related to viral genomic transcriptional regulation, and its modification led to an attenuated viral phenotype (Xu et al. 2016). Furthermore, the UL41 and LAT genes were also modified in the UL7-mutated strain, and the associated phenotype was identified in cell culture, mice, or macaques; compared with the WT strain, the mutant strain (M3) containing modified UL7, UL41 and LAT genes showed reduced proliferation in cell culture and asymptomatic infection in mice or macaques (Xu et al. 2017b; Fan et al. 2018). However, a study of M3 indicated that fewer copies of viral genomic DNA were detected in the trigeminal ganglion of infected animals by qPCR, and M3- infected mice were even found to be capable of defending against WT challenge with an asymptomatic outcome. This finding suggests that the immunity induced by M3 in mice is capable of decreasing viral pathologic lesions to a large extent but still lacks the capacity to control viral infection in neurons. Based on the strategy of immune evasion that HSV-1 deploys with its encoded molecules during infection, it might be reasonable to infer that specific modification of these targeted genes that interfere with immunity should modify or enhance the capacity of the immune system to limit virus spreading in vivo. Therefore, in our current work, we investigated the function of the Us3 and Us5 genes in viral immune evasion based on M3. The genes encoding both proteins were found to be highly conserved in alpha-herpesvirus and to play an important role in blocking cellular apoptosis induced via the Fas receptor or radiation; in particular, Us3-encoded molecules function to block viral-induced apoptosis in corneal epithelial cells and sensory neurons in the trigeminal ganglia following corneal infection in mice (Mori et al. 2006). Cellular apoptosis, as a part of innate immunity, plays an important role in assisting with immune control of viral spreading during the early stage of infection (Yu and He 2016). The results of our experiment indicated that M5, which was produced by modifying the Us3/Us5 genes in the M3 strain, was capable of inducing an approximately threefold increase in the cellular apoptosis rate compared with that of the WT or M3 strain. With previous reports that HSV-1 is capable of inhibiting cellular apoptosis to lead to a weakened nonspecific host response and immune recognition during infection (Yu and He 2016), this result provided an opportunity to study the relationships of both genes with the host immune response by using the M5 strain in comparison with the WT strain and the M3 strain. Further observation of the pathological outcome of challenged M3- or M5-infected mice indicated that both groups showed asymptomatic WT challenge compared with the typical acute manifestations and high rate of pathological death. However, histopathologic detection suggested that less inflammatory cell aggregation was found in the nervous tissues in the M5 group than in the M3 group, while the WT group presented an intense inflammatory reaction. The viral load assay further revealed a low number of copies of the viral genome in nervous system tissues, including the brain and trigeminal ganglion, in M5 group mice, but this value was slightly higher in the M3 group and significantly higher in the WT group. Interestingly, the neutralizing antibody assay indicated higher geometric mean titer (GMT) levels, with a titer of 1:128, in the M5 group mice after WT challenge, but the M3-infected mice showed a GMT titer of 1:40 after viral challenge, and the WT group showed lower GMT titers. However, although this titer could be recognized as higher than the baseline titer after M5 infection, we still do not have enough data to predict its potential as a vaccine candidate. We could infer that the M5 strain, with mutations in the Us3 and Us5 genes, exhibits an improved capacity to stimulate the host immune response and a reduced ability to inhibit cellular apoptosis. Besides, Us3 was also observed to inhibit the activation of NF-κB by superphosphorylation of p65 in virus-infected cells, to block the translocation of superphosphorylated IRF3 into the nucleus to inhibit IFN production, and to mediate evasion of HSV-1-specific CD8+ T cells (Imai et al. 2013; Wang et al. 2013, 2014). Thus, we have insufficient data to determine if this increased titer is due to the challenge virus penetrating the mucosal barrier and stimulating immune cells directly more effectively than M3. However, the homogenized trigeminal ganglion tissues of mice challenged with the M3 or M5 strain did not induce cytopathic effects in co-cultured Vero cells. The fact that a few viral genomic copies were found in nervous system tissues, especially in the trigeminal ganglion, suggests that the neurotrophic characteristic of M5 is still capable of evading immune control. Thus, controlling the neurotropic tendency of HSV-1 would require not only the enhancement of host immunity but also the modification of certain virus-encoded molecules, such as ICP-34.5, which was identified as being involved in viral neuropathogenesis (Orvedahl et al. 2007; Wilcox and Longnecker 2016).
-
This work was supported by the National Natural Science Foundation of China (81802868 and 31670173); the Fundamental Research Funds for the Central Universities (3332018129, 3332018197); the CAMS Initiative for Innovative Medicine (2016- I2M-1-019); and the Science and Technology Major Project of Yunnan Province (2017ZF006 and 2017ZF020). The funders had no role in the study design, data collection and analysis, the decision to publish, or in the preparation of the manuscript.
-
QL and XX designed the experiments; XX, YH, SF, GJ, YL, and LW performed the experiments; XX, YZ, and YL performed the analyses; XX and MF wrote the manuscript. All of the authors read and approved the final version of the manuscript.
-
The authors declare that they have no conflict of interest.
-
All institutional and national guidelines for the care and use of laboratory animals were followed. The experimental protocols were reviewed and approved by the Yunnan Provincial Experimental Animal Management Association (approval number: SCXK [Dian] 2013-0009).


 DownLoad: