


HTML
-
Chronic hepatitis C virus (HCV) infection is a major global health problem. Chronically infected patients may develop cirrhosis and liver cancer responsible for a substantial mortality (Lauer and Walker 2001). The World Health Organization estimates that approximately 71 million people are infected with HCV worldwide. HCV causes not only severe liver problems but also general metabolic manifestations, such as insulin resistance (IR) and type 2 diabetes mellitus (T2DM) (Jacobson et al. 2010; WHO 2017).
In case of chronic hepatitis C (CHC), a large interindividual variability in the risk of liver disease progression is observed. A subset of infected persons develops progressive hepatic fibrosis and subsequent cirrhosis, two conditions associated with a higher risk of hepatocellular carcinoma (HCC) (Thomas et al. 2000). In addition, the activation of pro-inflammatory mediators, such as nuclear factor-kappa-B and tumor necrosis factor α, caused by the chronic infection state, interferes with insulin signaling and contributes both to hepatic and peripheral insulin resistance (Maeno et al. 2003; Knobler and Schattner 2005). In agreement with the evidence suggesting a central role for reactive oxygen species in the development of insulin resistance, HCV infection is known to promote cellular oxidative stress through multiple mechanisms, including chronic inflammation, and iron overload. Some of the HCV proteins such as Core protein and NS5A (Nonstructural protein 5A) were reported to directly contribute to this process (Choi and Ou 2006; Houstis et al. 2006).
Peroxisome proliferator-activated receptor gamma coactivator 1 alpha (PPARGC1A) is one of the key regulators of various metabolic pathways through the modulation of adaptive thermogenesis, mitochondrial biogenesis, fatty acid oxidation, gluconeogenesis, and lipogenesis, all of which are to some extent perturbed in the development of non-alcoholic fatty liver disease (NAFLD) (Soyal et al. 2006). Thus, dysfunctions of this transcription factor are likely to contribute to the onset and progression of obesity and related metabolic disorders (Ramos-Lopez et al. 2018).
PPARGC1A co-activates several transcription factors, including hepatocyte nuclear factor-4α (HNF-4α) and forkhead box O1 (FOXO1), controlling, therefore, the transcription of rate-limiting gluconeogenic enzymes, such as phosphoenolpyruvate carboxykinase (PEPCK), pyruvate dehydrogenase kinase isoenzyme 4 (PDHK4) and glucose-6-phosphatase (G6Pase) (Finck and Kelly 2006).
PPARGC1A expression is dramatically elevated in HCV-infected cells, and accompanied by an upregulated expression of PEPCK and G6Pase (Li et al. 2007; Qadri et al. 2012). In addition, the HCV nonstructural protein 5A induces metabolic dysregulation and IR in human hepatoma cells, a process to which PPARGC1A could participate (Parvaiz et al. 2014). Furthermore, a recent study has reported that HCV infection induces PPARGC1A expression and endoplasmic reticulum (ER) stress. Moreover, pharmacological induction of ER stress upregulates PPARGC1A expression, and pharmacological inhibition of HCV-induced ER stress prevents PPARGC1A upregulation (Yao et al. 2014). Finally, treatment of HCV replicon cells with the antioxidant N-acetylcysteine can attenuate PPARGC1A induction, suggesting that HCV-promoted PPARGC1A expression is mediated by oxidative stress and inflammation (Shlomai et al. 2012).
Several studies reported an association between PGC-1α polymorphism at position +1564G/A (rs8192678) with NAFLD, T2DM and metabolic syndrome, which is associated with the substitution of Gly with Ser (Gly482Ser) (Ek et al. 2001; Kunej et al. 2004; Vohl et al. 2005; Yoneda et al. 2008; Burgueno et al. 2013; Saremi et al. 2019). In addition, rs12640088 had a significant interaction with body mass index (BMI) (Barroso et al. 2006; Villegas et al. 2014). These studies have been conducted in Japan, Europe, Argentina and Iran i.e. in countries rather distant from Morocco. North Africa is known for the high prevalence of overweight and obesity that affect its populations, we were still curious to explore HCV and PPARGC1A in the Moroccan genetic context. These two polymorphisms in the Moroccan population have not yet been studied and needs to be explored. In this context, the aim of the current study was to investigate the effects of two polymorphisms of PPARGC1A gene in patients from a North Africa infected with HCV: a G to A transition at position + 1564 in exon 8 (that predicted a glycine to serine amino acid substitution at position 482, and therefore referred to as Gly482Ser: rs8192678) and intron variant rs12640088 A > C. These two SNPs have been previously associated with several human diseases, including type 2 diabetes, and obesity (Barroso et al. 2006; Villegas et al. 2014).
-
A total of 592 Moroccan subjects were enrolled in this case–control study at the Medical Center of Biology at the Pasteur Institute of Morocco and in the department of Medicine B at the Ibn Rochd university hospital, Casablanca from May 2012 to January 2016. This study included 292 patients with persistent HCV infection, 100 individuals who spontaneously cleared the virus, and 200 healthy controls. Each participant completed a structured questionnaire on demographic data, medical history, lifestyle features and other characteristics. Peripheral blood from the study subjects was collected on EDTA-containing tubes.
CHC are defined as patients persistently positive both for anti-hepatitis C virus (anti-HCV) antibodies and for HCV RNA by quantitative reverse transcriptase-polymerase chain reaction (qRT-PCR) for at least 6 months. In these patients, histological features were assessed noninvasively using FibroTest-ActiTest combining α-2-macroglobulin, GGT, apolipoprotein A1, haptoglobin, total bilirubin, age and gender (Biopredictive, Paris, France). Patients were stratified into two groups according to fibrosis stage. Among chronic HCV patients, 92 had mild chronic hepatitis C (mCHC i.e. patients with F0–F2 fibrosis stages), 200 patients had advanced liver disease (AdLD i.e. patients with F3–F4 or HCV-related-HCC).
The HCV-spontaneous clearance group was positive for anti-HCV and negative for HCV RNA by qRT-PCR according to at least two measurements performed more than 6 months apart. Healthy controls were negative for hepatitis serological markers and with normal serum levels of alanine aminotransferase (ALT) and aspartate aminotransferase (AST) with no current or past history of liver disease. Patients with evidence of co-infection with human immunodeficiency virus, hepatitis B virus infection or presence of autoimmune liver disease were excluded from the study.
-
Serological markers were tested for HBsAg, anti-HCV (Axsym/Architect, Abbott Diagnostics, Wiesbaden-Delkenheim, Germany) and anti-HIV (Genscreen Ag/Ab HIV Ultra, Biorad, Marnes La Coquette, France). Plasma HCV-RNA was measured by qPCR using COBAS AmpliPrep/COBAS TaqMan (Roche Diagnostics, Germany). HCV RNA level below the detection threshold (15 IU/mL) was scored as negative for HCV RNA. ALT, AST, gamma-glutamyltransferase (GGT), bilirubin, total cholesterol, high density lipoprotein (HDL), low density lipoprotein (LDL) and triglycerides were collected at time of blood sampling by two separate interviews.
-
Genomic DNA was isolated from the peripheral blood mononuclear cells as described previously (Ezzikouri et al. 2018). Genotyping for PPARGC1A rs8192678 and rs12640088 was undertaken using the TaqMan SNP genotyping allelic discrimination method (Thermo Fisher Scientific, Foster City, CA, USA) using a Light Cycler® 480 Real-Time PCR System (Roche diagnostics, Manheim, Germany). Genomic DNA was amplified in a 10 μl reaction volume containing 1 × SensiFAST Genotyping LoRox Mix (Bioline, London, UK), SNP Genotyping Assay, genomic DNA (20 ng), and completed with DNase-free water.
-
Clinical and biochemical data are presented as arithmetic mean ± standard deviation, and differences between groups were assessed with the Student's t test for quantitative variables with a normal distribution. Otherwise, Wilcoxon-Mann–Whitney test was applied for non-normally distributed quantitative traits. Hardy–Weinberg equilibrium (HWE) was assessed using SNP-HWE program. Genotype frequencies were compared between groups by regression analysis under dominant, co-dominant, recessive and log-additive models of inheritance. Results were expressed as p-value, odds ratio (OR), and 95% confidence interval (CI). All statistical procedures were performed with R software for Windows and the effect of genetic polymorphism on spontaneous clearance was examined with the SNPassoc R package (https://www.r-project.org). P-value < 0.05 was considered a significant difference. All statistical tests were two-sided.
Patients and Healthy Controls
Serological and Molecular Analyses
Genomic DNA Isolation and PPARGC1A Polymorphisms Genotyping
Statistical Analysis
-
In the present case–control study, a total of 592 volunteers were enrolled, among these 292 individuals with persistent HCV infection including 92 patients with mild chronic hepatitis C and 200 with advanced liver disease (AdLD) including liver cirrhosis and hepatocellular carcinoma. In addition, 100 subjects who spontaneously cleared HCV and 200 healthy controls were recruited. The demographic, biochemical, viral characteristics of the study population are shown in Table 1.
Healthy controls (n = 200) Chronic HCV infection (n = 292) HCV-spontaneous clearance (n = 100) Age (years) 55 [13-93] 63 [20-88] 58 [20-76] Gender (%) Male 67 (33.5) 108 (36) 41(41) Female 133 (66.5) 192 (64) 59 (59) Biochemical variables (mean ± SD) Alanine aminotransferase (IU/L) 35.33 ± 21.52 78.43 ± 55.23 46.44 ± 56.25 Aspartate aminotransferase (IU/L) 29.35 ± 16.39 68.85 ± 46.25 34.7 ± 21.43 Bilirubin (μmol/L) NA 15.19 ± 6.08 15.16 ± 11.17 Creatinine (μmol/L) NA 108.54 ± 199.72 82.34 ± 34.55 Fasting serum glucose (g/L) 0.95 ± 0.19 1.06 ± 0.41 1.23 ± 0.54 Total cholesterol (g/L) 1.91 ± 0.38 1.53 ± 0.36 1.72 ± 0.38 Triglycerides (g/L) 1.31 ± 0.68 1.04 ± 0.37 1.37 ± 1.33 HDL-cholesterol (g/L) 0.54 ± 0.36 0.52 ± 0.17 0.48 ± 0.10 LDL-cholesterol (g/L) 1.11 ± 0.38 0.86 ± 0.6 0.94 ± 0.36 Median viral load (IU/mL) NA 2.8 E + 06 - [range] [0.9 E + 03 - 64.5 E + 06] Viral genotypes (%) Genotype 1 - 59.90 - Genotype 2 - 39.06 - Genotype 3 - 0.52 - Genotype 4 - 0.52 - Disease stages (n) mCHC - 92 - AdLD - 127 - HCC - 73 - SD standard deviation, Na non applicable, HDL high density lipoprotein, LDL low density lipoprotein, mCHC mild chronic hepatitis C, AdLD advanced liver disease, HCC hepatocellular carcinoma. Table 1. Baseline characteristics of healthy subjects, chronic HCV patients and HCV-spontaneous clearance group.
Patients with advanced liver fibrosis were older (P < 0.0001) than the others. Serum aminotransferases and bilirubin levels were very significantly increased in the AdLD group as compared to the mCHC group (P < 0.0001). Moreover, AdLD patients exhibited significantly higher values of fasting serum glucose (P= 0.003) but lower total cholesterol and LDL-cholesterol values compared to the mCHC group (P < 0.05). No significant difference was observed regarding creatinine, triglyceride, HDL-cholesterol and HCV viral load between AdLD and mCHC groups (Table 2). An analysis of biological parameters and viral characteristic of patients with CHC infection according to HCV genotypes was also performed. We observed that patients infected with HCV genotype 1 have higher serum triglyceride (P= 0.001) and lower LDL-cholesterol levels (P= 0.01) compared to genotype 2-infected patients. There was no difference regarding fasting serum glucose, total cholesterol and HDL-cholesterol levels between genotypes 1 and 2 (P > 0.05, data not shown). Likewise, serum aminotransferase level was significantly higher in HCV genotype 1-infected group compared to the genotype 2-infected subset (P= 0.01, Data not shown). However, no significant difference between HCV genotypes regarding viral loads was observed (P> 0.05, data not shown). These results confirm that the progression of the liver disease due to HCV includes both features of liver injury and metabolic traits with genotype 1 apparently capable to more profoundly disturb liver function than genotype 2.
Mild chronic hepatitis (n = 92) Advanced liver disease (n = 200) P value Mean age ± SD (years) 57.13 ± 14.09 64.14 ± 9.47 < 0.0001 Gender (%) Male 26 (27.37) 41 (31.30) 0.558 Female 69 (72.63) 90 (68.70) Biochemical variables (mean ± SD) Alanine aminotransferase (IU/L) 53.63 ± 39.77 96.69 ± 58.73 < 0.0001 Aspartate aminotransferase (IU/L) 42.91 ± 24.91 87.94 ± 51.96 < 0.0001 Bilirubin (μmol/L) 13.13 ± 5.54 16.76 ± 6.01 < 0.0001 Creatinine (μmol/L) 87.91 ± 165.39 130.56 ± 249.41 0.148 Fasting serum glucose (g/L) 0.97 ± 0.19 1.14 ± 0.53 0.003 Total cholesterol (g/L) 1.60 ± 0.36 1.47 ± 0.31 0.004 Triglycerides (g/L) 1.03 ± 0.38 1.06 ± 0.40 0.570 HDL-cholesterol (g/L) 0.54 ± 0.19 0.51 ± 0.15 0.186 LDL-cholesterol (g/L) 0.91 ± 0.68 0.74 ± 0.31 0.012 Median viral load (IU/mL) 2.7 E + 06 2.9 E + 06 0.818 [range] [1.7 E + 03-31.8 E + 06] [0.9 E + 03-64.5 E + 06] Viral genotypes (%) Genotype 1 53.85 64.03 0.114 Genotype 2 46.15 34.21 - Genotype 3 - 0.88 - Genotype 4 - 0.88 - SD standard deviation, HDL high density lipoprotein, LDL low density lipoprotein. Table 2. Baseline characteristics of mild and advanced liver diseases groups.
-
To estimate the frequencies of the PPARGC1A polymorphisms in Moroccan population, rs8192678 and rs12640088 SNPs were genotyped in 200 healthy controls. The distributions of both SNPs in healthy control group complied with Hardy–Weinberg equilibrium (P> 0.05). The minor allele (A) frequency (MAF) in Moroccan population was 0.175 for rs8192678 and 0.115 for rs12640088, respectively (Table 3).
PPARGC1A Healthy controls n = 200 (%) Spontaneous clearance n = 100 (%) Persistent infection n = 292 (%) Subjects with persistence versus subjects with spontaneous clearance OR (95% Cl) P value rs8192678 G/G 142 (71) 48 (48) 166 (56.85) 1 G/A 46 (23) 44 (44) 105 (35.96) 0.69 [0.43-1.11] 0.126 A/A 12(6) 8 (8) 21 (7.19) 0.76 [0.32-1.82] 0.536 G allele 0.825 ± 0.021 0.700 ± 0.032 0.748 ± 0.018 1 A allele 0.175 ± 0.021 0.300 ± 0.032 0.252 ± 0.018 0.78 [0.55-1.12] 0.181 Dominant model 48/52 166/126 0.70 [0.44-1.10] 0.125 Recessive model 92/8 271/21 1.12 [0.48-2.62] 0.789 rs12640088 A/A 154 (77) 75 (75) 221 (75.68) 1 A/C 46 (23) 22 (22) 64 (21.92) 0.99 [0.57-1.71] 0.963 C/C 0 (0) 3 (3) 7 (2.40) 0.79 [0.20-3.14] 0.739 A allele 0.885 ± 0.015 0.860 ± 0.026 0.866 ± 0.014 1 C allele 0.115 ± 0.015 0.140 ± 0.026 0.134 ± 0.014 0.95 [0.59-1.51] 0.818 Dominant model 75/25 221/71 0.96 [0.57-1.63] 0.890 Recessive model 97/3 285/7 1.26 [0.32-4.97] 0.745 Table 3. Effect of PPARGC1A polymorphisms on the outcomes of HCV infection.
-
Outcomes regarding the impact of PPARGC1A variant on spontaneous HCV clearance are displayed in Table 3. Prevalence of homozygous A/A genotype at rs8192678 was 8.0% in the spontaneously recovered group and 7.2% in the HCV persistent group, while homozygous C/C genotype at rs12640088 was 3.0% in the spontaneous recovery group compared to 2.4% in the persistence group. There were no significant differences in the distribution of the genotype frequencies between groups (P> 0.05).
When the rs8192678 G/G and rs12640088 A/A genotypes were used as the reference group, none of the G/A, A/A and A/C, C/C genotypes were associated with chronicity (adjusted ORs = 0.69, 95% CI 0.43–1.11; 0.76, 95% CI 0.32–1.82 and 0.99, 95% CI 0.57–1.71; 0.79, 95% CI 0.20–3.14, respectively). The A/A and C/C genotypes were not associated either with spontaneous resolution of HCV infection.
-
In order to analyze the effect of the two polymorphisms on liver disease progression in the Moroccan population, we tested the association of rs8192678 and rs12640088 with fibrosis stage by multiple logistic regression analysis adjusted for age, gender and viral load. CHC patients were stratified according to fibrosis stages as absent/mild (Mild group) or significant (AdLD group). The result indicated that age, male sex, cholesterol, GGT, ALT and AST were associated with advanced fibrosis (P < 0.05). On the other hand, we observed an absence of impact of both rs8192678 AA and rs12640088 CC genotypes on progression of liver disease (OR = 0.71; 95% CI 0.20–2.49; P= 0.739; OR = 1.28; 95% CI 0.25–6.54; P= 0.512, respectively Table 4).
Mild group (n = 92) Advanced group (n = 200) OR 95% CI P value Age (years) 58.5 [51-67] 65 [58-73] 1.06 1.04-1.09 < 0.001 Male sex (%) 23 (25.0%) 81 (41.3%) 2.1 1.23-3.71 0.011 Total cholesterol (g/L) 1.64 [1.36-1.85] 1.42 [1.27-1.68] 0.23 0.07-0.75 0.015 Triglycerides (g/L) 0.96 [0.81-1.27] 0.98 [0.78-1.21] 1.12 0.41-3.06 0.874 HDL (g/L) 0.52 [0.42-0.66] 0.51 [0.38-0.60] 0.14 0.01-1.73 0.232 LDL (g/L) 0.89 [0.60-1.15] 0.80 [0.50-1.00] 0.42 0.10-1.68 0.200 Gamma-glutamyltransferase (IU/L) 27.0 [19.040.0] 63.5 [38.2-119] 1.02 1.01-1.03 < 0.001 ALT (IU/L) 40.5 [28.2-61.8] 82.0 [54.0-123] 1.02 1.01-1.04 < 0.001 AST (IU/L) 33.5 [27.0-44.2] 76.0 [51.5-116] 1.04 1.02-1.06 < 0.001 PPARGC1A rs8192678 AA genotype 4 (4.35%) 8 (6.30%) 0.71 0.20-2.49 0.739 PPARGC1A rs12640088 CC genotype 3 (2.36) 3 (2.36) 1.28 0.25-6.54 0.512 Factors associated with progression of liver disease in chronic hepatitis C patients.
HDL high density lipoprotein, LDL low density lipoprotein, ALT alanine aminotransferase, AST Aspartate aminotransferase, PPARGC1A Peroxisome proliferator-activated receptor gamma coactivator 1 alpha, OR Odds ratio, CI confidence interval.Table 4. Factors associated with disease progression of HCV infection.
-
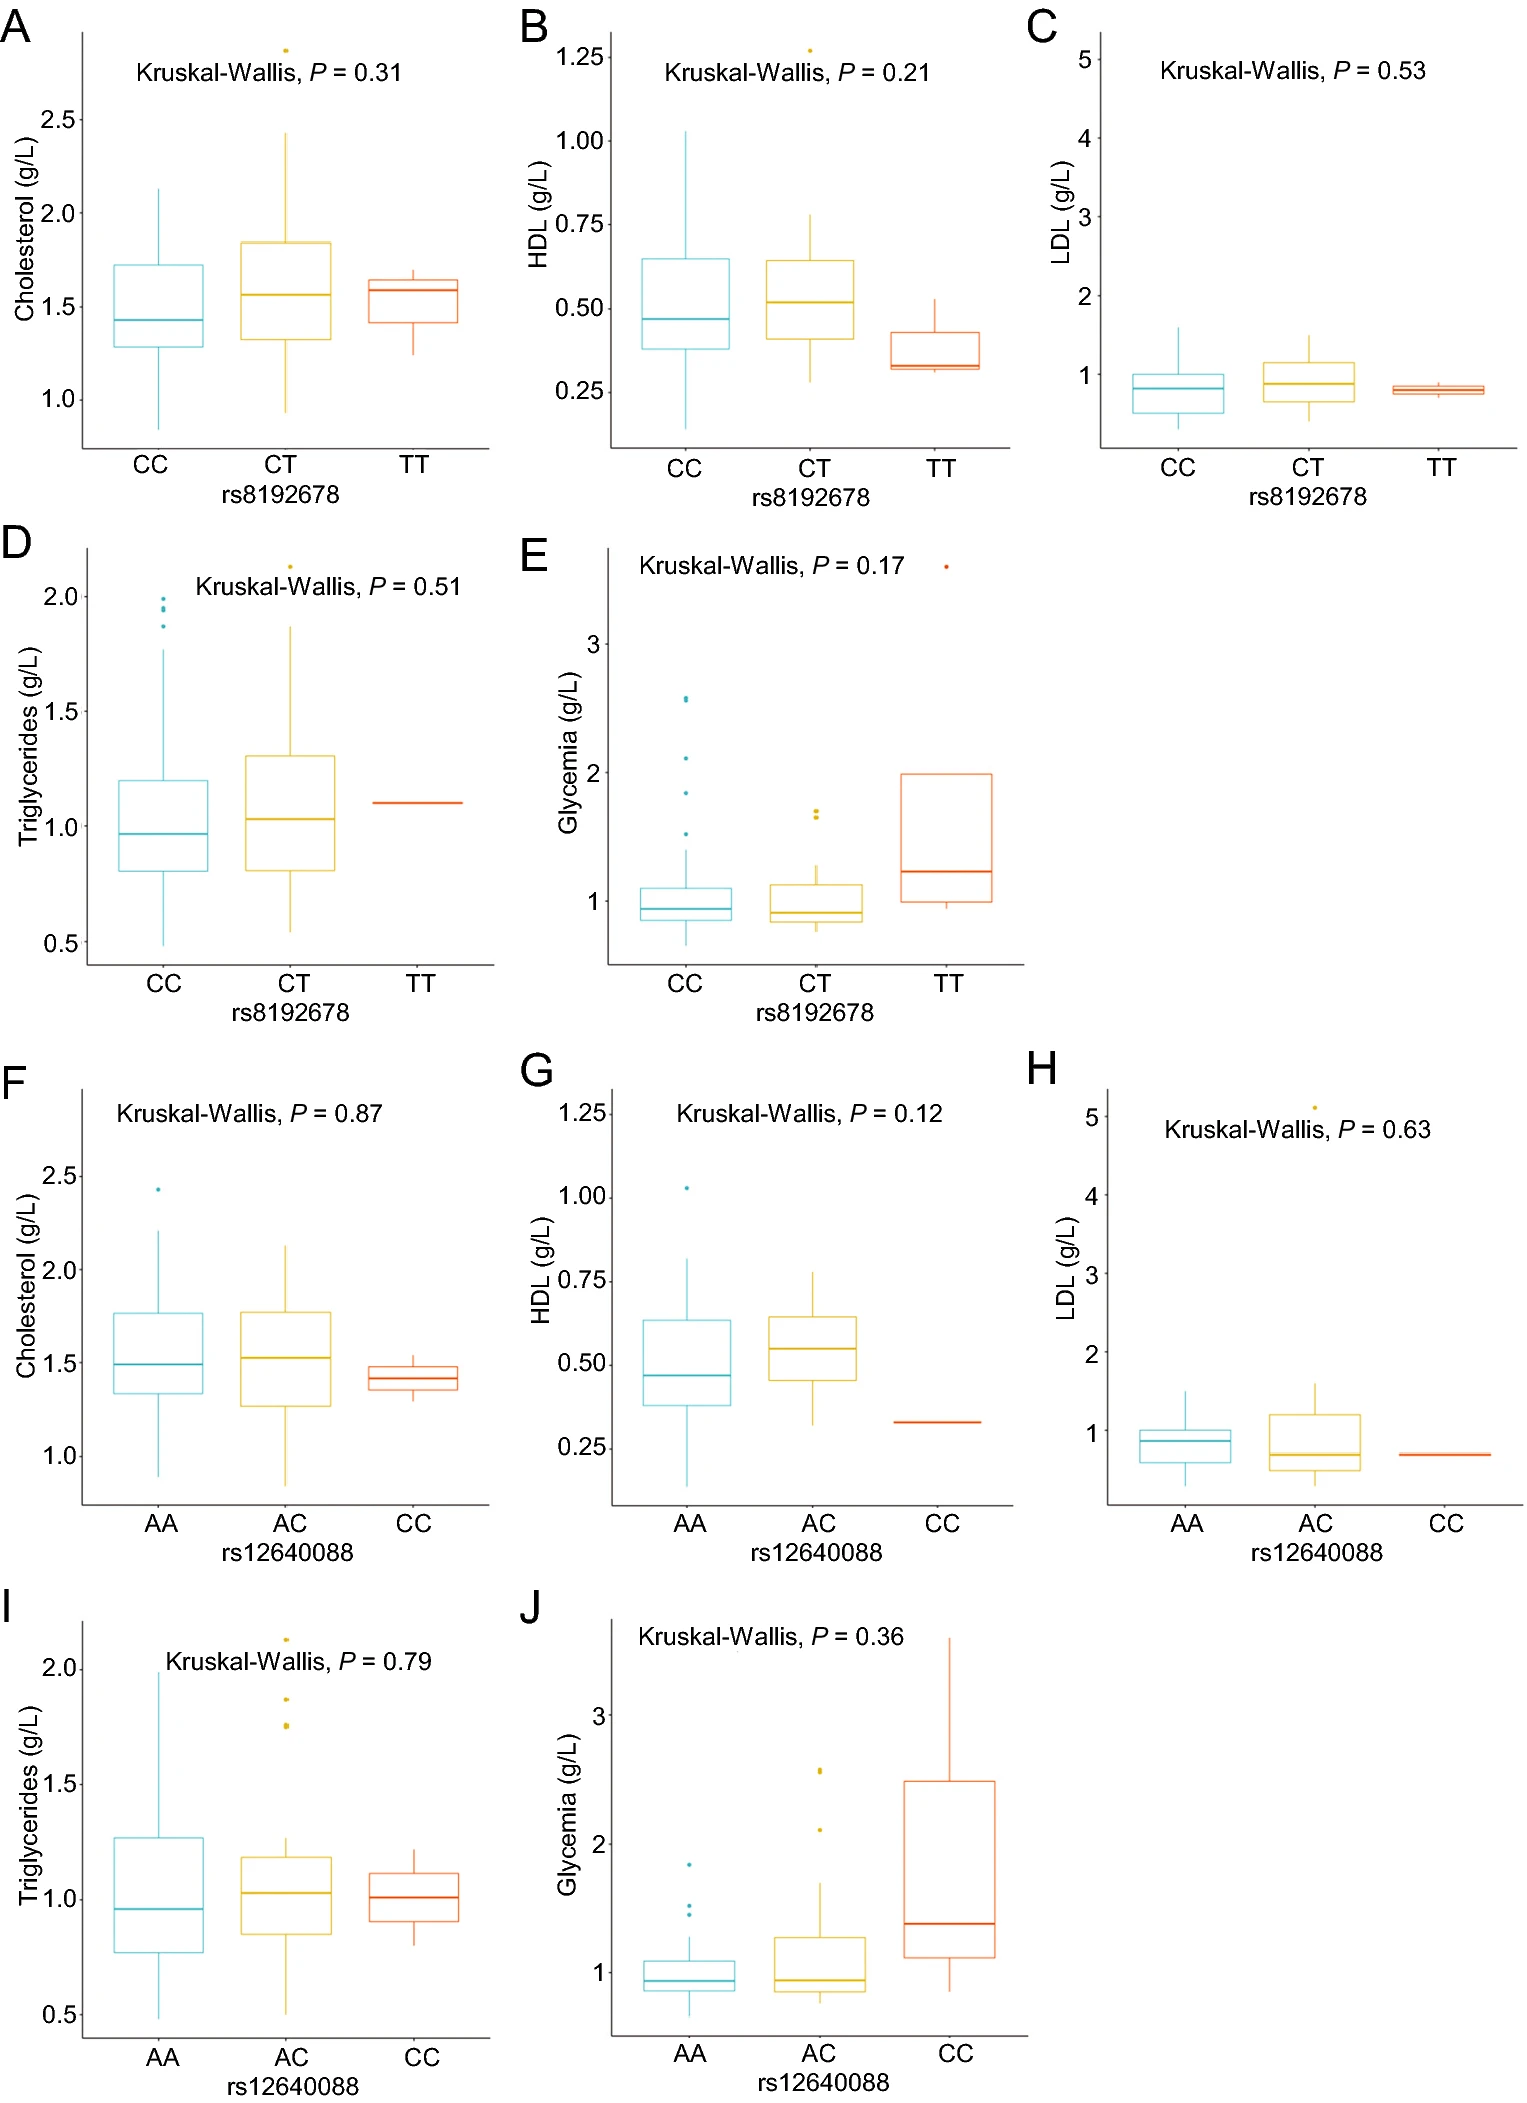
No significant associations were found between rs8192678 and rs12640088 SNPs with biochemical features available (Fig. 1).

Figure 1. Association of rs8192678 and rs12640088 genotypes with lipid profile and blood glucose in CHC patients. Expression of serum cholesterol (A), HDL (B), LDL (C), Triglycerides (D) and Glycemia (E) according to genotypes of PPARGC1A rs8192678. Expression of serum cholesterol (F), HDL (G), LDL (H), Triglycerides (I) and Glycemia (J) according to genotypes of PPARGC1A rs12640088. Data are expressed as the mean and standard deviation. Statistical analyses were performed using Kruskal–Wallis.
Clinical and Demographical Features
Frequency of PPARGC1A Genotypes
Association between PPARGC1A Polymorphisms and Spontaneous Clearance of HCV Infection
Association between the rs8192678 and rs12640088 Polymorphisms and Disease Progression of HCV Infection
Biochemical and Metabolic Data in Patients with CHC Infection According to PPARGC1A Polymorphisms
-
HCV-related liver disease is known to progress gradually from chronic hepatitis to liver cirrhosis and to hepatocellular carcinoma (HCC) in a significant subset of infected subjects (Niederau et al. 1998). It has been shown that both viral and host factors are involved in HCV spontaneous clearance and disease progression (Mosley et al. 2005). Metabolic factors may affect the course of chronic hepatitis C (CHC). Obesity and the metabolic syndrome are conditions associated with liver manifestations, including steatosis and fibrosis. In individuals with chronic hepatitis C, obesity is associated with an exacerbation of inflammation, insulin resistance, steatosis, progression of fibrosis. Furthermore, these patients are considered as poor responders to treatment with IFN-α (Hui et al. 2003; White et al. 2008; Lazo et al. 2017). In the Middle-East and North Africa (MENA) region, metabolic impact of HCV is suspected to synergize with the pathological burden due to a widespread prevalence of overweight, obesity and T2D (Tazi et al. 2003; Musaiger 2011).
The peroxisome proliferator-activated receptor gamma coactivator 1-alpha is a novel transcriptional co-activator playing an important role in lipid and glucose metabolisms. Genetic variations in this gene were associated with obesity, type 2 diabetes, and some other related diseases (Mirzaei et al. 2012). It is known to regulate lipid metabolism and long-chain fatty acid oxidation by upregulating the expression of several genes of the tricarboxylic acid cycle and the mitochondrial fatty acid oxidation pathway (Cheng et al. 2018). PPARGC1A gene is a transcriptional coactivator of the nuclear receptor PPARγ that exerts powerful effects on hepatic glucose and fat metabolism and may be involved in the development of NAFLD (Estall et al. 2009). A protective role of rs8192678 against hepatic steatosis has been found both in vivo and in vitro (Chen et al. 2013; Tai et al. 2016). Furthermore, recent evidence of a direct role for PPARGC1A inactivation in the pathogenesis of steatosis and HCC has been obtained in a mouse model combining HCV core transgene with PPARGC1A knockout where a liver steatosis was induced (Tanaka et al. 2008). Meanwhile, HCV core protein has been shown to reduce mitochondrial long chain fatty acid β-oxidation by impairing the expression and function of PPARGC1A (Cheng et al. 2005; Dharancy et al. 2005).
As no data was available concerning the association of PPARGC1A variants and liver disease progression so far, we set out to explore the role of PPARGC1A gene polymorphisms rs8192678 and rs12640088 in liver disease progression of Moroccan patients chronically infected with HCV. In the population studied, the MAF frequency for rs8192678 was 0.175, which is lower than frequencies reported in both Caucasians and Asian population (Tai et al. 2016). However, regarding the rs12640088, the MAF was 0.115 in line with those reported in Caucasians and Asian population (Tai et al. 2016).
To our knowledge, this is the first description of the relationship between PPARGC1A gene rs8192678 and rs12640088 polymorphisms and the clearance of HCV infection. The major finding of our study was a lack of association of both SNPs in PPARGC1A and spontaneous resolution of HCV infection. Furthermore, in the present study, we found that PPARGC1A rs8192678 and rs12640088 are not associated with the risk of liver disease progression in CHC. Our data are, thus, at odd with previous studies that found a significant association between PPARGC1A rs8192678 (Gly482Ser) polymorphism and HCC development, in a primarily HBV-infected Eastern Chinese Han population (Zhang et al. 2018). Moreover, Liu and colleagues found that a decreased expression of PPARGC1A plays an important role in the formation and development of HCC, while the overexpression of PPARGC1A in HCC cell lines promotes apoptosis, suggesting that PPARGC1A may be a tumor suppressor and potential therapeutic target for HCC (Liu et al. 2017).
Regarding the metabolic aspects of the disease, our data did not reveal any significant associations with clinical characteristics such as liver enzymes, carbohydrates metabolism and lipid profile in CHC patients. These observations suggest that genetic variations affections PPARGC1A are not crucial determinants in the genetic architecture and the pathological spectrum of North African and possibly Middle Eastern populations.
In conclusion, the PPARGC1A variants are neither associated with spontaneous resolution of HCV infections nor with progression of the chronic liver disease. Our study has some limitations, including missing data on the PPARGC1A expression in HCV-infected liver biopsies. Moreover, we are fully aware that another limitation of the current study is the relatively small size of the cohort examined. Further surveys combining the recruitment of a larger number of subjects and analyses of additional polymorphisms in PPARGC1A gene will help to clarify its role in HCV infections and progression. Further studies on North African patients with non-virus induced NAFLD, are warranted to definitively refute or confirm an effect of rs8192678 and rs12640088 on liver diseases progression.
-
The authors would like to acknowledge all patients for their participation in this study.
-
SB, SE, RE conceived, designed the experiments and wrote the paper; SB, SE, MK and PP contributed to the drafting and revision of the article; IZ, FZJ and HC helped in the collection of samples; WB and MT contributed to the clinical data; MEI helped in the statistical analysis; IC and AM helped in the interpretation of data; SB contributed to the final approval of the version to be submitted. All authors read and approved the final manuscript.
-
Authors declare that they have no conflict of interest.
-
The study was approved by the Ethics Committee of the Faculty of Medicine of Casablanca in accordance with the ethical guidelines of the Declaration of Helsinki. For study participation, written informed consent for genetic testing was obtained from all subjects.


 DownLoad: